


Trusted by over 15 Million Traders
The Most Awarded Broker
for a Reason
Easy Access to 1,400+ Global Assets
EURUSD
Euro vs U.S. Dollar
US500
S&P 500 (US500)
GOLD
Gold
COFFEE
US Coffee
Apple
Apple (AAPL.OQ)
-

Finance Magnates 颁发
-

Finance Magnates 颁发
-

Capital Finance International Magazine (CFI.co) 2024年颁赠
-

COLWMA 2024年颁赠
-

荣获World Finance Forex Awards 2023最佳外汇客户服务奖
-

荣获World Finance Forex Awards 2023欧洲最佳外汇经纪商奖
-

荣获World Finance Forex Awards 2023澳大拉西亚最佳外汇经纪商奖
-

荣获World Finance Forex Awards 2023拉丁美洲最佳外汇经纪商奖
-

荣获World Finance Forex Awards 2023中东最佳外汇经纪商奖
-

CFI.co于2023年颁赠
-

荣获2023年City of London Wealth Management Awards
-

荣获2022年埃及金融博览会颁赠
-

荣获2022年City of London Wealth Management Awards
-

CFI.co于2022年颁赠
-

荣获Global Forex Awards 2022 — 零售外汇 颁赠
-
2021年迪拜外汇博览会获颁赠
-

Ultimate Fintech 2021年颁赠
-

荣获2021年City of London Wealth Management Awards
-

FX168于2020年12月颁赠
-

荣获Global Business Awards 2020
-

荣获2020年City of London Wealth Management Awards
-

Capital Finance International Magazine (CFI.co)颁赠
-

Capital Finance International Magazine (CFI.co)颁赠
-

荣获2019年City of London Wealth Management Awards
-

Shares Magazine 授予 UK Forex Awards 2018
-

Capital Finance International Magazine (CFI.co)颁赠
-

Capital Finance International Magazine (CFI.co)颁赠
-

2017年伦敦财富管理奖
-

2016最佳本土 客户服务
-

中东和北非地区(MENA)增长最快的经纪商
-
2015年最佳外汇科技提供商
-
2014年最佳外汇科技提供商
-

2014年最佳外汇科技提供商
-

荣获 The Trading Show 2024年非洲 Africa Fintech 峰会颁赠
-

荣获2024年中东地区 Brokersview 颁赠
-
荣获2024年中东地区 Brokersview 颁赠
-

荣获2024年阿曼 Smart Vision 峰会颁赠
-

荣获2024年迪拜外汇博览会颁赠
-

荣获2024年迪拜 Forex Traders Summit 颁赠
-

2024年埃及 Smart Vision 峰会颁赠
-

投查查于2024年颁赠
-

Capital Finance International Magazine (CFI.co) 2024年颁赠
-

CFI.co于2023年颁赠
-

CFI.co于2023年颁赠
-

交易社区平台FOLLOWME于2022年颁赠
-
2022年迪拜Forex Expo获颁赠
-
2022年迪拜Forex Expo获颁赠
-

荣获Global Forex Awards 2022 — 零售外汇 颁赠
-

CFI.co于2022年颁赠
-

CFI.co于2022年颁赠
-

World Finance Forex Awards 2022 颁发
-

World Finance Forex Awards 2022 颁发
-

World Finance Forex Awards 2022 颁发
-

World Finance Forex Awards 2022 颁发
-
交易社区平台FOLLOWME于2021年颁赠
-

2021年埃及Smart Vision Investment Expo博览会获颁赠
-

CFI.co于2021年颁赠
-

CFI.co于2021年颁赠
-

荣获Global Forex Awards 2021 — 零售外汇 颁赠
-

荣获Global Forex Awards 2021 — 零售外汇 颁赠
-

World Finance 2021颁发
-

World Finance 2021颁发
-
FOLLOWME于2021年颁赠
-

Global Forex Awards 2021 — B2B 颁赠
-

Global Forex Awards颁赠
-

Global Forex Awards颁赠
-

CFI.co于2020年颁赠
-

CFI.co于2020年颁赠
-

荣获Global Business Awards 2020
-

World Finance Magazine 颁赠
World Finance Forex Awards 2020 -

World Finance Magazine 颁赠
World Finance Forex Awards 2020 -
FOLLOWME交易社区授予
-

Global Forex Awards颁赠
-

Global Forex Awards颁赠
-

FinTech Age Awards颁发
-

World Finance Magazine 颁赠
World Finance Forex Awards 2019 -

World Finance Magazine 颁赠
World Finance Forex Awards 2019 -

荣获 World Finance Forex Awards 2018 颁赠
-

荣获2018年埃及金融博览会颁赠
-

荣获 Shares Magazine 的 UK Forex Awards 2017 颁赠
-

荣获 World Finance Forex Awards 2017
-

2016年最佳黄金经纪商
-

2016年最佳外汇经纪商
-

2015年最佳本地客户服务
-

Global Brands Magazine 颁赠
-

Online Money Awards 2022 颁发
-

荣获2022年埃及金融博览会颁赠
-

2015最佳外汇交易平台
-

2015最佳金融交易平台
-

2013最佳创新外汇平台奖
-

2020年 Cyprus HR Awards 颁赠
-

金融行业的佼佼者
-

认证最优金牌级别
-

2014年首届亚军
-
Finance Magnates 颁发
-
Finance Magnates 颁发
-
Capital Finance International Magazine (CFI.co) 2024年颁赠
-
COLWMA 2024年颁赠
-
荣获World Finance Forex Awards 2023最佳外汇客户服务奖
-
荣获World Finance Forex Awards 2023欧洲最佳外汇经纪商奖
-
荣获World Finance Forex Awards 2023澳大拉西亚最佳外汇经纪商奖
-
荣获World Finance Forex Awards 2023拉丁美洲最佳外汇经纪商奖
-
荣获World Finance Forex Awards 2023中东最佳外汇经纪商奖
-
CFI.co于2023年颁赠
-
荣获2023年City of London Wealth Management Awards
-
荣获2022年埃及金融博览会颁赠
-
荣获2022年City of London Wealth Management Awards
-
CFI.co于2022年颁赠
-
荣获Global Forex Awards 2022 — 零售外汇 颁赠
-
2021年迪拜外汇博览会获颁赠
-
Ultimate Fintech 2021年颁赠
-
荣获2021年City of London Wealth Management Awards
-
FX168于2020年12月颁赠
-
荣获Global Business Awards 2020
-
荣获2020年City of London Wealth Management Awards
-
Capital Finance International Magazine (CFI.co)颁赠
-
Capital Finance International Magazine (CFI.co)颁赠
-
荣获2019年City of London Wealth Management Awards
-
Shares Magazine 授予 UK Forex Awards 2018
-
Capital Finance International Magazine (CFI.co)颁赠
-
Capital Finance International Magazine (CFI.co)颁赠
-
2017年伦敦财富管理奖
-
2016最佳本土 客户服务
-
中东和北非地区(MENA)增长最快的经纪商
-
2015年最佳外汇科技提供商
-
2014年最佳外汇科技提供商
-
2014年最佳外汇科技提供商
-
荣获 The Trading Show 2024年非洲 Africa Fintech 峰会颁赠
-
荣获2024年中东地区 Brokersview 颁赠
-
荣获2024年中东地区 Brokersview 颁赠
-
荣获2024年阿曼 Smart Vision 峰会颁赠
-
荣获2024年迪拜外汇博览会颁赠
-
荣获2024年迪拜 Forex Traders Summit 颁赠
-
2024年埃及 Smart Vision 峰会颁赠
-
投查查于2024年颁赠
-
Capital Finance International Magazine (CFI.co) 2024年颁赠
-
CFI.co于2023年颁赠
-
CFI.co于2023年颁赠
-
交易社区平台FOLLOWME于2022年颁赠
-
2022年迪拜Forex Expo获颁赠
-
2022年迪拜Forex Expo获颁赠
-
荣获Global Forex Awards 2022 — 零售外汇 颁赠
-
CFI.co于2022年颁赠
-
CFI.co于2022年颁赠
-
World Finance Forex Awards 2022 颁发
-
World Finance Forex Awards 2022 颁发
-
World Finance Forex Awards 2022 颁发
-
World Finance Forex Awards 2022 颁发
-
交易社区平台FOLLOWME于2021年颁赠
-
2021年埃及Smart Vision Investment Expo博览会获颁赠
-
CFI.co于2021年颁赠
-
CFI.co于2021年颁赠
-
荣获Global Forex Awards 2021 — 零售外汇 颁赠
-
荣获Global Forex Awards 2021 — 零售外汇 颁赠
-
World Finance 2021颁发
-
World Finance 2021颁发
-
FOLLOWME于2021年颁赠
-
Global Forex Awards 2021 — B2B 颁赠
-
Global Forex Awards颁赠
-
Global Forex Awards颁赠
-
CFI.co于2020年颁赠
-
CFI.co于2020年颁赠
-
荣获Global Business Awards 2020
-
World Finance Magazine 颁赠
World Finance Forex Awards 2020 -
World Finance Magazine 颁赠
World Finance Forex Awards 2020 -
FOLLOWME交易社区授予
-
Global Forex Awards颁赠
-
Global Forex Awards颁赠
-
FinTech Age Awards颁发
-
World Finance Magazine 颁赠
World Finance Forex Awards 2019 -
World Finance Magazine 颁赠
World Finance Forex Awards 2019 -
荣获 World Finance Forex Awards 2018 颁赠
-
荣获2018年埃及金融博览会颁赠
-
荣获 Shares Magazine 的 UK Forex Awards 2017 颁赠
-
荣获 World Finance Forex Awards 2017
-
2016年最佳黄金经纪商
-
2016年最佳外汇经纪商
-
2015年最佳本地客户服务
-
Global Brands Magazine 颁赠
-
Online Money Awards 2022 颁发
-
荣获2022年埃及金融博览会颁赠
-
2015最佳外汇交易平台
-
2015最佳金融交易平台
-
2013最佳创新外汇平台奖
-
2020年 Cyprus HR Awards 颁赠
-
金融行业的佼佼者
-
认证最优金牌级别
-
2014年首届亚军

Awarded BestBrokerYear After Year
CATEGORIES
News
- 【XM Forex】--USD/JPY Forecast: Near Key Support at 150
- 【XM Group】--USD/SGD Analysis: Highs Challenged and Await Speculative FX Decision
- 【XM Group】--USD/ZAR Analysis: Holiday Nervousness and Some Near-Term Indications
- 【XM Market Review】--GBP/USD Analysis: Holds Neutral, Eyes Key Resistance
- 【XM Market Review】--GBP/USD Forex Signal: Eyes Bearish Breakout
market news
Gold 3200 is the short-term bottom, with 3222 lows already hit, bullish
Wonderful introduction:
A clean and honest man is the happiness of honest people, a prosperous business is the happiness of businessmen, a punishment of evil and traitors is the happiness of chivalrous men, a good character and academic performance is the happiness of students, aiding the poor and helping the poor is the happiness of good people, and planting in spring and harvesting in autumn is the happiness of farmers.
Hello everyone, today XM Forex will bring you "[XM Forex]: Gold 3200 is the short-term bottom, 3222 lows have been hit, bullish". Hope it will be helpful to you! The original content is as follows:
Zheng's silver point: Gold 3200 is the short-term bottom, 3222 lows have been hit, bullish
Review the market trend and technical points that appeared last Friday:
First, gold: Last Thursday, the entire network notified that 3200 is expected to become a short-term bottom, hold the 3190 defense and start the bottom speculation, the first target 3160-3170 is finally in place; and above There were two regrets on Friday: one is that the original US market research report prompted a rebound to 3240 and continued to be bullish, but the plan could not keep up with the changes. It bottomed out several times in 5 minutes, and was tempted to enter the market early. I was anxious, and the market was washed away. Then it continued to be bullish above 3240, and profits were reduced below 3260; the second regret is that a big negative hit the market in the early morning. In fact, the full and big positive at 23 o'clock had stabilized; the reason why it Another wave of decline is to tempt the market rebound and shortness, and it just happened to pierce the starting point of 3227 intraday, which is also the 618 division position, and then it opens today to wait for an opportunity to rise; although the research report expects that suppressing 3275-3280 may appear to have a second bottom, and a second low point will stabilize again, but the timing of the xm-links.coming is wrong. On the one hand, 3275-3280 is not tested, and on the other hand, the bottom is full and the big sun K is slightly unexpected; In any case, the short-term adjustment will still be achieved in the end, and the long-term return trend will eventually xm-links.come, just wait patiently;
Second, silver: its trend cannot keep up with gold in the past few days, and its trends even have different directions, so it will not be easy to proceed simultaneously;
Interpretation of today's market analysis:
First, the medium- and long-term level of gold: in terms of monthly lines, it continued to close positively last month, forcibly breaking through the upward channelThe upper track, after the first retracement at the beginning of this month, it is expected to further pull up, to replenish the upper shadow line, and even break through 3500; in terms of weekly lines, the closing of the negative last week was considered to have xm-links.completed a certain retracement action, and after piercing the MA5 moving average, it bottomed out and rose. Once it returns to above 3277 on the 5th this week, it will continue to strengthen in the medium term to test the upward channel upper track;
Second, the gold daily line level: the current trend pattern is very similar to before and after the Qingming Festival. After the big negative K, they follow the cross K closely, and then The big sun K forms a "morning star" at the bottom, ending the short-term adjustment; this time it should be easier than last time. Last time, the big shade fell behind the middle track. This time the middle track is relatively firm and it can never effectively break the level. There are only two short-term suppression points. MA5-day resistance is 3270, and MA10-day resistance is 3303. As long as the closing line breaks above 3303 at a certain moment, it will change from the bottom oscillation and stabilization stage to a strong one-sided pull-up stage. If the speed is fast, you can test the 3500 mark again within a week; from 2 The first wave started at 832, 2956 is the low point of the second wave pullback, 3500 is the high point of the third wave pullback, and 3201 is the low point of the fourth wave pullback. Next is the pullback of the last fifth wave. According to the standard multiple, it can be pointed at at least above 3600; in short, the trend bulls this year are never changed. Every wave of squat adjustments are prepared to further set a record high. Don’t guess the top, there is no highest, only higher; once the market opens tomorrow, more buying will pour in; < /p>
Third, gold 4-hour level: divide the 3500-3201 round as the high and low. The current pressure is the 236 division resistance 3272 line. Once the breakout is above the station, it is the 382 division resistance 3315 line. This round of division pressure should be 618 resistance 3386, which happens to be the high point of the previous sideways range. The direct breakthrough here is 3500 and breaking up; however, generally, 618 will be under pressure and get some more time;
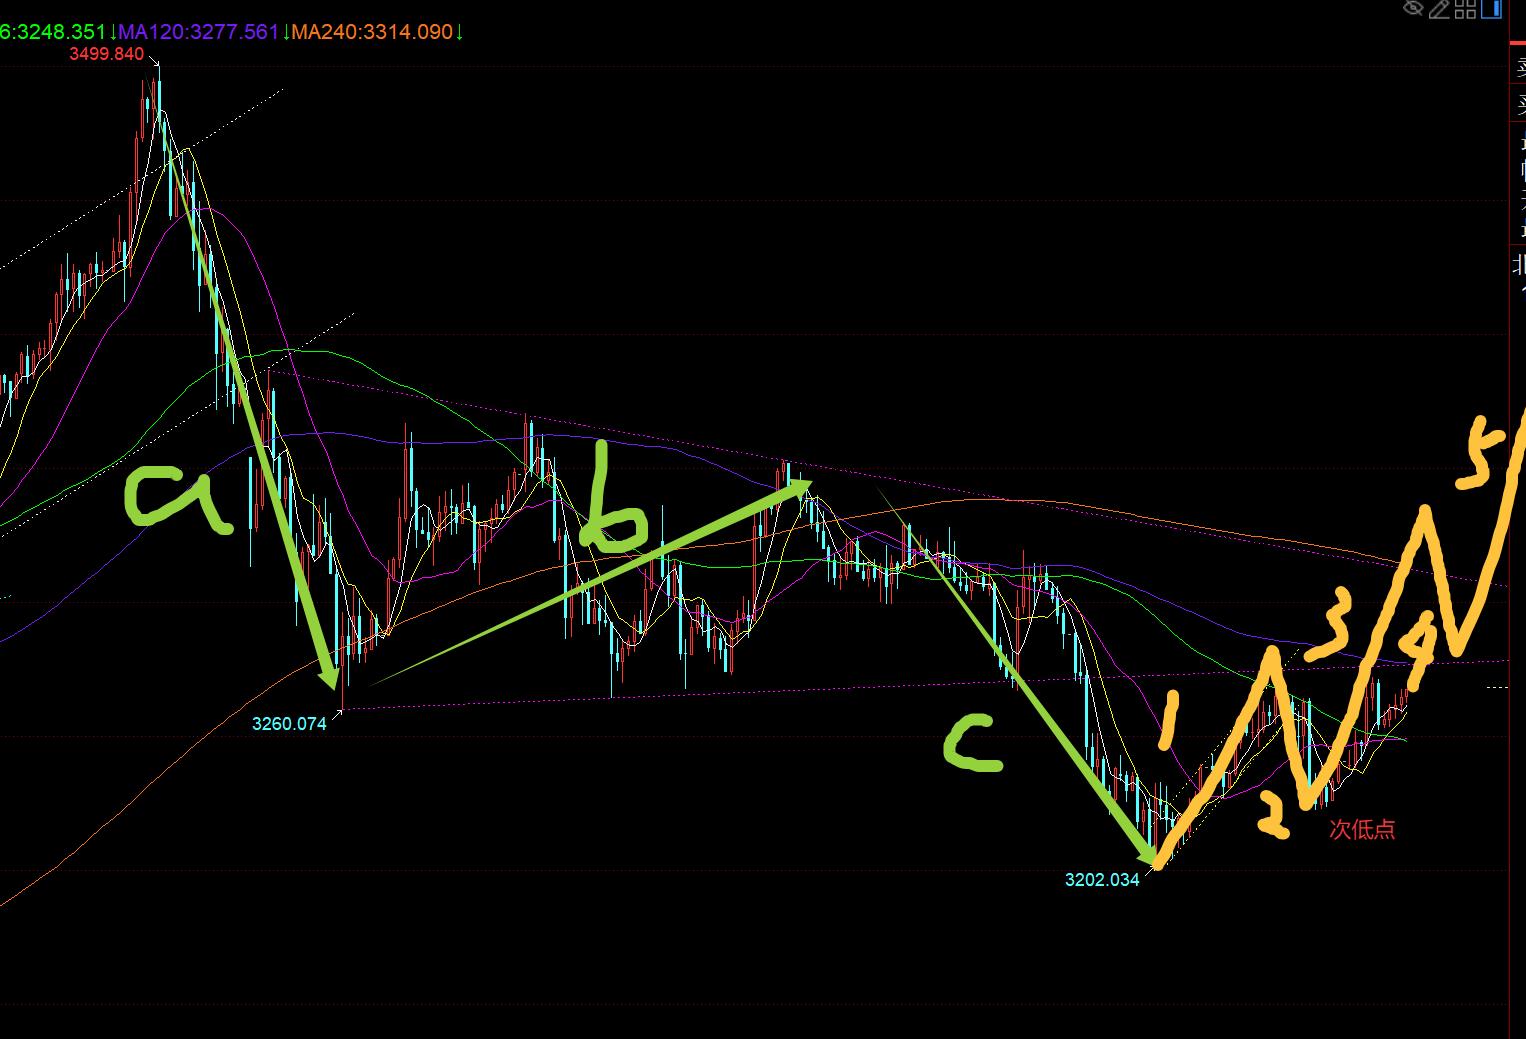
Fourth, golden hourly line level: From the above chart, the 3201 line is currently predicted to be the short-term bottom, the abc pullback wave has ended, and the new five waves are currently opened. 3201-3269 is the first wave, and the 3222 is the second wave, so the height of the third wave can be calculated according to the standard multiple, which can point to the 3332 line; in addition, from the previous convergence triangle lower rail reverse pressure point, the pressure 3277 line pays attention to, and then the upper rail will gradually look at 3310-15 after breaking through the station, which is also close to the annual moving average position (maybe the subsequent convergence triangle is not meaningful, because time has passed, you can pay attention to whether the upper and lower rails are repeatedly linked to judge); now use the 10 moving average as the support point to maintain a slow rise and upward, and the single yin and yang pattern continues to be bullish above 3259;
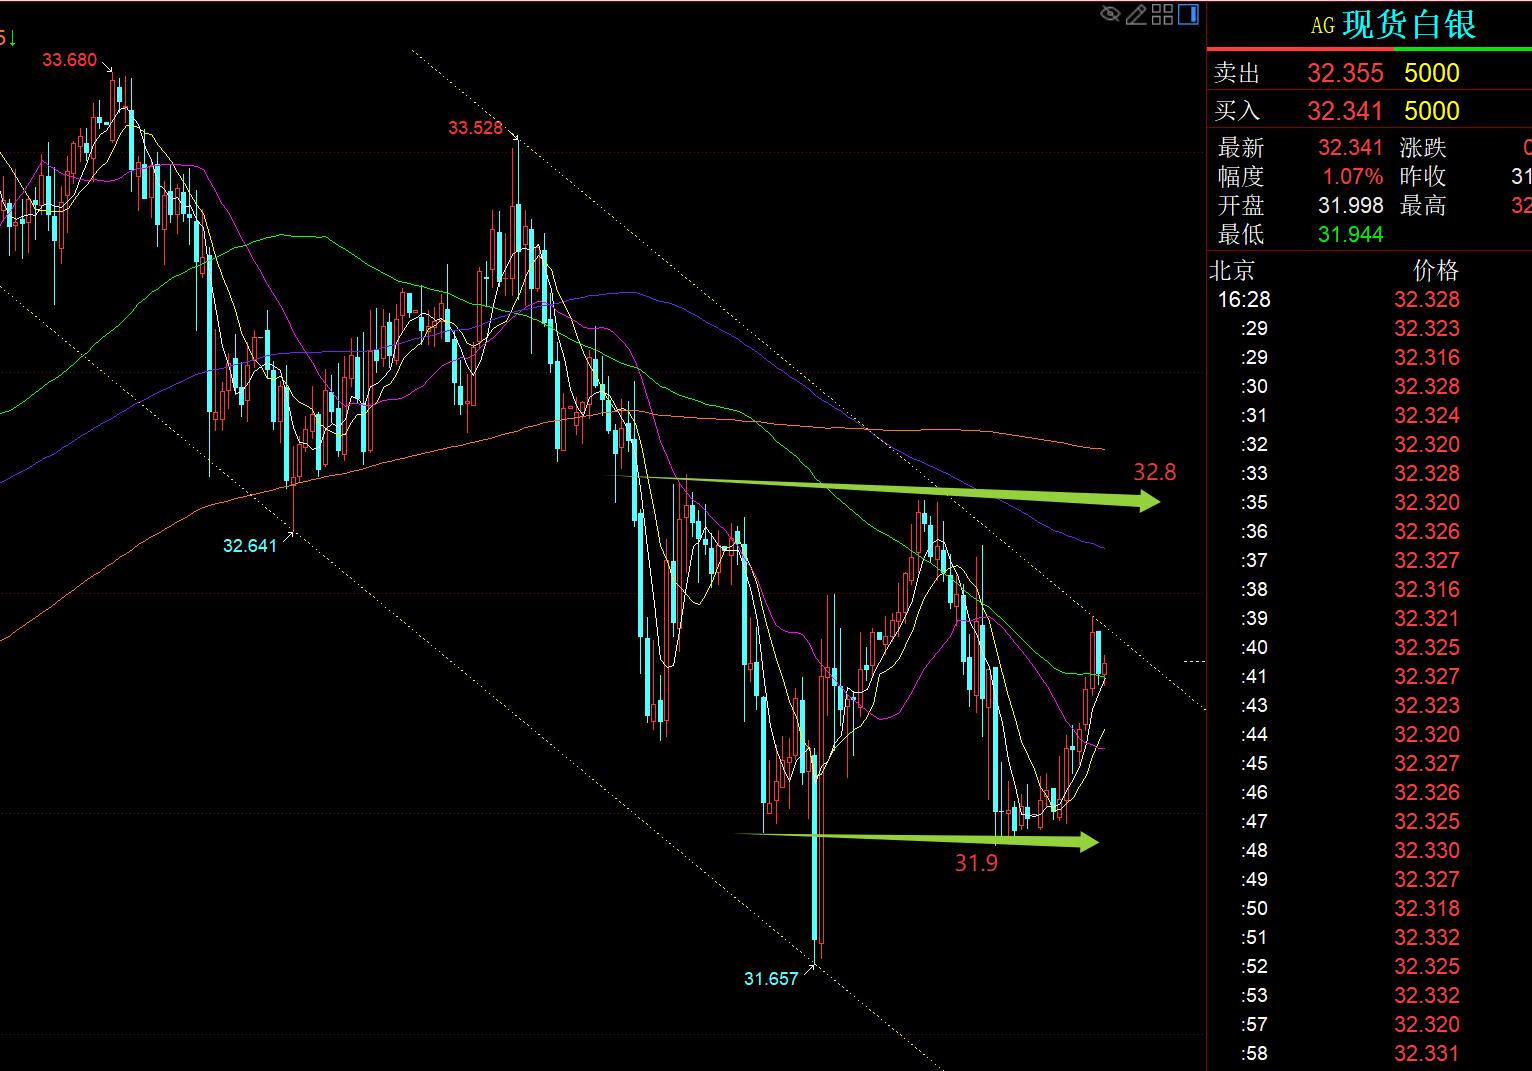
Silver: From the above chart, silver is in a volatile downward channel. Testing the upper track. Only by breaking through the 32.8 can it turn stronger and pull up again; using 31.9 as the double bottom, using this as defense, relying on the mid track above 32.1 to try to oscillate and bullish when it is low;
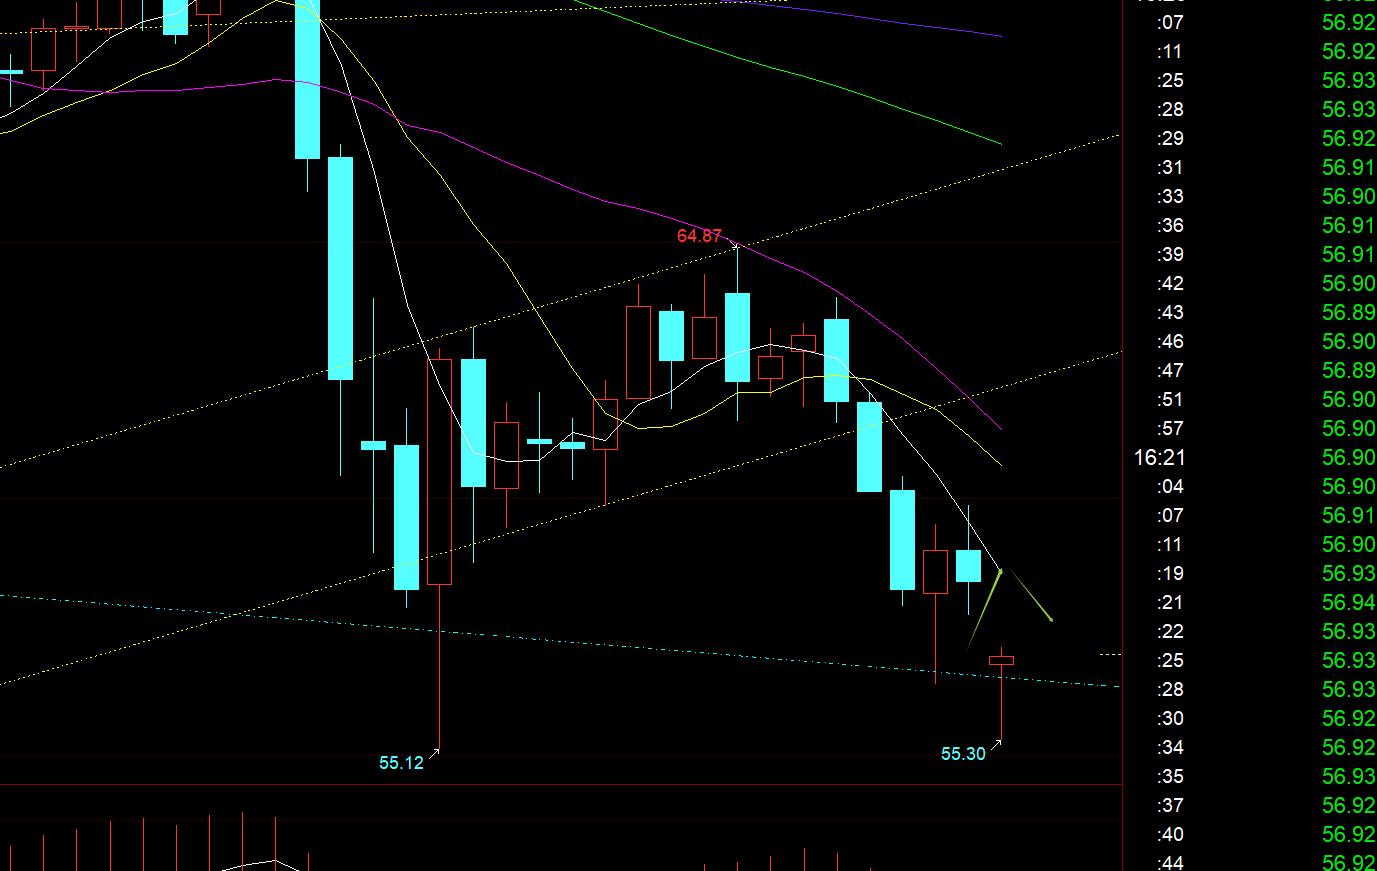
Crude oil: Due to the news of the increase in production on the weekend, today's opening jumped 5% lower. Pay attention to the daily rebound of 5 moving averages 58.5-58 and continue to look at the weak under pressure. It is also to fill the gap before choosing bearishness.
The above are several points of the author's technical analysis. As a reference, it is also a summary of the technical experience accumulated by the market and reviewing more than 12 hours a day in the past twelve years. Technical points are disclosed every day, and they are used to interpret text and videos. Friends who want to learn can xm-links.compare and refer to them based on the actual trend. Those who recognize ideas can refer to operations, lead defense well, and risk control first; those who do not agree should just float by; thank everyone for their support and attention;
[The article views are for reference only. Investment is risky. You must be cautious, operate rationally, strictly set losses, control positions, risk control first, and you will be responsible for your own profits and losses]
Contributor: Zheng's Dianyin
After more than 12 hours a day, we have persisted for ten years, and have detailed technical interpretations on the entire network, serving the whole network with sincerity, sincerity, sincerity, perseverance and wholeheartedness! xm-links.comments written on major financial websites! Proficient in the K-line rules, channel rules, time rules, moving average rules, segmentation rules, and top and bottom rules; student cooperation registration hotline - WeChat: zdf289984986
The above content is about " [XM Foreign Exchange]: Gold 3200 is the short-term bottom, 3222 lows have been hit, and it is bullish" is carefully xm-links.compiled and edited by the editor of XM Foreign Exchange. I hope it will be helpful to your trading! Thank you for your support!
After doing something, there will always be experiences and lessons. In order to facilitate future work, you must analyze, study, summarize, and concentrate the experience and lessons of your past work, and raise it to the theoretical level to understand.
Disclaimers: XM Group only provides execution services and access permissions for online trading platforms, and allows individuals to view and/or use the website or the content provided on the website, but has no intention of making any changes or extensions, nor will it change or extend its services and access permissions. All access and usage permissions will be subject to the following terms and conditions: (i) Terms and conditions; (ii) Risk warning; And (iii) a complete disclaimer. Please note that all information provided on the website is for general informational purposes only. In addition, the content of all XM online trading platforms does not constitute, and cannot be used for any unauthorized financial market trading invitations and/or invitations. Financial market transactions pose significant risks to your investment capital.
All materials published on online trading platforms are only intended for educational/informational purposes and do not include or should be considered for financial, investment tax, or trading related consulting and advice, or transaction price records, or any financial product or non invitation related trading offers or invitations.
All content provided by XM and third-party suppliers on this website, including opinions, news, research, analysis, prices, other information, and third-party website links, remains unchanged and is provided as general market commentary rather than investment advice. All materials published on online trading platforms are only for educational/informational purposes and do not include or should be considered as applicable to financial, investment tax, or trading related advice and recommendations, or transaction price records, or any financial product or non invitation related financial offers or invitations. Please ensure that you have read and fully understood the information on XM's non independent investment research tips and risk warnings. For more details, please click here