


Trusted by over 15 Million Traders
The Most Awarded Broker
for a Reason
Easy Access to 1,400+ Global Assets
EURUSD
Euro vs U.S. Dollar
US500
S&P 500 (US500)
GOLD
Gold
COFFEE
US Coffee
Apple
Apple (AAPL.OQ)
-

Finance Magnates 颁发
-

Finance Magnates 颁发
-

Capital Finance International Magazine (CFI.co) 2024年颁赠
-

COLWMA 2024年颁赠
-

荣获World Finance Forex Awards 2023最佳外汇客户服务奖
-

荣获World Finance Forex Awards 2023欧洲最佳外汇经纪商奖
-

荣获World Finance Forex Awards 2023澳大拉西亚最佳外汇经纪商奖
-

荣获World Finance Forex Awards 2023拉丁美洲最佳外汇经纪商奖
-

荣获World Finance Forex Awards 2023中东最佳外汇经纪商奖
-

CFI.co于2023年颁赠
-

荣获2023年City of London Wealth Management Awards
-

荣获2022年埃及金融博览会颁赠
-

荣获2022年City of London Wealth Management Awards
-

CFI.co于2022年颁赠
-

荣获Global Forex Awards 2022 — 零售外汇 颁赠
-
2021年迪拜外汇博览会获颁赠
-

Ultimate Fintech 2021年颁赠
-

荣获2021年City of London Wealth Management Awards
-

FX168于2020年12月颁赠
-

荣获Global Business Awards 2020
-

荣获2020年City of London Wealth Management Awards
-

Capital Finance International Magazine (CFI.co)颁赠
-

Capital Finance International Magazine (CFI.co)颁赠
-

荣获2019年City of London Wealth Management Awards
-

Shares Magazine 授予 UK Forex Awards 2018
-

Capital Finance International Magazine (CFI.co)颁赠
-

Capital Finance International Magazine (CFI.co)颁赠
-

2017年伦敦财富管理奖
-

2016最佳本土 客户服务
-

中东和北非地区(MENA)增长最快的经纪商
-
2015年最佳外汇科技提供商
-
2014年最佳外汇科技提供商
-

2014年最佳外汇科技提供商
-

荣获 The Trading Show 2024年非洲 Africa Fintech 峰会颁赠
-

荣获2024年中东地区 Brokersview 颁赠
-
荣获2024年中东地区 Brokersview 颁赠
-

荣获2024年阿曼 Smart Vision 峰会颁赠
-

荣获2024年迪拜外汇博览会颁赠
-

荣获2024年迪拜 Forex Traders Summit 颁赠
-

2024年埃及 Smart Vision 峰会颁赠
-

投查查于2024年颁赠
-

Capital Finance International Magazine (CFI.co) 2024年颁赠
-

CFI.co于2023年颁赠
-

CFI.co于2023年颁赠
-

交易社区平台FOLLOWME于2022年颁赠
-
2022年迪拜Forex Expo获颁赠
-
2022年迪拜Forex Expo获颁赠
-

荣获Global Forex Awards 2022 — 零售外汇 颁赠
-

CFI.co于2022年颁赠
-

CFI.co于2022年颁赠
-

World Finance Forex Awards 2022 颁发
-

World Finance Forex Awards 2022 颁发
-

World Finance Forex Awards 2022 颁发
-

World Finance Forex Awards 2022 颁发
-
交易社区平台FOLLOWME于2021年颁赠
-

2021年埃及Smart Vision Investment Expo博览会获颁赠
-

CFI.co于2021年颁赠
-

CFI.co于2021年颁赠
-

荣获Global Forex Awards 2021 — 零售外汇 颁赠
-

荣获Global Forex Awards 2021 — 零售外汇 颁赠
-

World Finance 2021颁发
-

World Finance 2021颁发
-
FOLLOWME于2021年颁赠
-

Global Forex Awards 2021 — B2B 颁赠
-

Global Forex Awards颁赠
-

Global Forex Awards颁赠
-

CFI.co于2020年颁赠
-

CFI.co于2020年颁赠
-

荣获Global Business Awards 2020
-

World Finance Magazine 颁赠
World Finance Forex Awards 2020 -

World Finance Magazine 颁赠
World Finance Forex Awards 2020 -
FOLLOWME交易社区授予
-

Global Forex Awards颁赠
-

Global Forex Awards颁赠
-

FinTech Age Awards颁发
-

World Finance Magazine 颁赠
World Finance Forex Awards 2019 -

World Finance Magazine 颁赠
World Finance Forex Awards 2019 -

荣获 World Finance Forex Awards 2018 颁赠
-

荣获2018年埃及金融博览会颁赠
-

荣获 Shares Magazine 的 UK Forex Awards 2017 颁赠
-

荣获 World Finance Forex Awards 2017
-

2016年最佳黄金经纪商
-

2016年最佳外汇经纪商
-

2015年最佳本地客户服务
-

Global Brands Magazine 颁赠
-

Online Money Awards 2022 颁发
-

荣获2022年埃及金融博览会颁赠
-

2015最佳外汇交易平台
-

2015最佳金融交易平台
-

2013最佳创新外汇平台奖
-

2020年 Cyprus HR Awards 颁赠
-

金融行业的佼佼者
-

认证最优金牌级别
-

2014年首届亚军
-
Finance Magnates 颁发
-
Finance Magnates 颁发
-
Capital Finance International Magazine (CFI.co) 2024年颁赠
-
COLWMA 2024年颁赠
-
荣获World Finance Forex Awards 2023最佳外汇客户服务奖
-
荣获World Finance Forex Awards 2023欧洲最佳外汇经纪商奖
-
荣获World Finance Forex Awards 2023澳大拉西亚最佳外汇经纪商奖
-
荣获World Finance Forex Awards 2023拉丁美洲最佳外汇经纪商奖
-
荣获World Finance Forex Awards 2023中东最佳外汇经纪商奖
-
CFI.co于2023年颁赠
-
荣获2023年City of London Wealth Management Awards
-
荣获2022年埃及金融博览会颁赠
-
荣获2022年City of London Wealth Management Awards
-
CFI.co于2022年颁赠
-
荣获Global Forex Awards 2022 — 零售外汇 颁赠
-
2021年迪拜外汇博览会获颁赠
-
Ultimate Fintech 2021年颁赠
-
荣获2021年City of London Wealth Management Awards
-
FX168于2020年12月颁赠
-
荣获Global Business Awards 2020
-
荣获2020年City of London Wealth Management Awards
-
Capital Finance International Magazine (CFI.co)颁赠
-
Capital Finance International Magazine (CFI.co)颁赠
-
荣获2019年City of London Wealth Management Awards
-
Shares Magazine 授予 UK Forex Awards 2018
-
Capital Finance International Magazine (CFI.co)颁赠
-
Capital Finance International Magazine (CFI.co)颁赠
-
2017年伦敦财富管理奖
-
2016最佳本土 客户服务
-
中东和北非地区(MENA)增长最快的经纪商
-
2015年最佳外汇科技提供商
-
2014年最佳外汇科技提供商
-
2014年最佳外汇科技提供商
-
荣获 The Trading Show 2024年非洲 Africa Fintech 峰会颁赠
-
荣获2024年中东地区 Brokersview 颁赠
-
荣获2024年中东地区 Brokersview 颁赠
-
荣获2024年阿曼 Smart Vision 峰会颁赠
-
荣获2024年迪拜外汇博览会颁赠
-
荣获2024年迪拜 Forex Traders Summit 颁赠
-
2024年埃及 Smart Vision 峰会颁赠
-
投查查于2024年颁赠
-
Capital Finance International Magazine (CFI.co) 2024年颁赠
-
CFI.co于2023年颁赠
-
CFI.co于2023年颁赠
-
交易社区平台FOLLOWME于2022年颁赠
-
2022年迪拜Forex Expo获颁赠
-
2022年迪拜Forex Expo获颁赠
-
荣获Global Forex Awards 2022 — 零售外汇 颁赠
-
CFI.co于2022年颁赠
-
CFI.co于2022年颁赠
-
World Finance Forex Awards 2022 颁发
-
World Finance Forex Awards 2022 颁发
-
World Finance Forex Awards 2022 颁发
-
World Finance Forex Awards 2022 颁发
-
交易社区平台FOLLOWME于2021年颁赠
-
2021年埃及Smart Vision Investment Expo博览会获颁赠
-
CFI.co于2021年颁赠
-
CFI.co于2021年颁赠
-
荣获Global Forex Awards 2021 — 零售外汇 颁赠
-
荣获Global Forex Awards 2021 — 零售外汇 颁赠
-
World Finance 2021颁发
-
World Finance 2021颁发
-
FOLLOWME于2021年颁赠
-
Global Forex Awards 2021 — B2B 颁赠
-
Global Forex Awards颁赠
-
Global Forex Awards颁赠
-
CFI.co于2020年颁赠
-
CFI.co于2020年颁赠
-
荣获Global Business Awards 2020
-
World Finance Magazine 颁赠
World Finance Forex Awards 2020 -
World Finance Magazine 颁赠
World Finance Forex Awards 2020 -
FOLLOWME交易社区授予
-
Global Forex Awards颁赠
-
Global Forex Awards颁赠
-
FinTech Age Awards颁发
-
World Finance Magazine 颁赠
World Finance Forex Awards 2019 -
World Finance Magazine 颁赠
World Finance Forex Awards 2019 -
荣获 World Finance Forex Awards 2018 颁赠
-
荣获2018年埃及金融博览会颁赠
-
荣获 Shares Magazine 的 UK Forex Awards 2017 颁赠
-
荣获 World Finance Forex Awards 2017
-
2016年最佳黄金经纪商
-
2016年最佳外汇经纪商
-
2015年最佳本地客户服务
-
Global Brands Magazine 颁赠
-
Online Money Awards 2022 颁发
-
荣获2022年埃及金融博览会颁赠
-
2015最佳外汇交易平台
-
2015最佳金融交易平台
-
2013最佳创新外汇平台奖
-
2020年 Cyprus HR Awards 颁赠
-
金融行业的佼佼者
-
认证最优金牌级别
-
2014年首届亚军

Awarded BestBrokerYear After Year
CATEGORIES
News
- 【XM Group】--GBP/USD Forecast: Cable Continues to Struggle for Momentum
- 【XM Forex】--GBP/USD Forecast: Tests Key Resistance at 1.27
- 【XM Market Analysis】--USD/JPY Analysis: Bulls Tighten Grip
- 【XM Group】--USD/MXN Forecast: Fighting Back
- 【XM Group】--ETH/USD Forecast: Ethereum Pulls Back Against FOMC Backdrop
market analysis
【XM Group】--Weekly Forex Forecast – Gold, EUR/USD, S&P 500 Index, Copper Futures
Risk Warning:
The purpose of information release is to warn investors of risks and does not constitute any investment advice. The relevant data and information are from third parties and are for reference only. Investors are requested to verify before use and assume all risks.
Hello everyone, today XM Forex will bring you "【XM Group】--Weekly Forex Forecast – Gold, EUR/USD, S&P 500 Index, Copper Futures". I hope it will be helpful to you! The original content is as follows:
Fundamental Analysis & Market Sentiment
I wrote on 23rd March that the best trades for the week would be:
The overall result was a loss of 0.02%.
Last week saw several important data releases affecting the Forex market:
Last week’s key takeaways were:
The Week Ahead: 31st March – 4th April
The xm-links.coming week has a slightly heavier schedule of important releases, so we may see a rise from last week’s relatively low volatility over the xm-links.coming week.
This week’s important data points, in order of likely importance, are:
Monthly Forecast April 2025
For March 2025, I made no forecast, as there were no clear trends at the start of this month.
For the month of April 2025, I again make no forecast, as the Forex market is dull and there are only mixed long-term trends.
Weekly Forecast 31st March 2025
Last week, I made no weekly forecast, as there were no unusually strong movements in any weekly currency crosses.
This week, I again make no forecast.
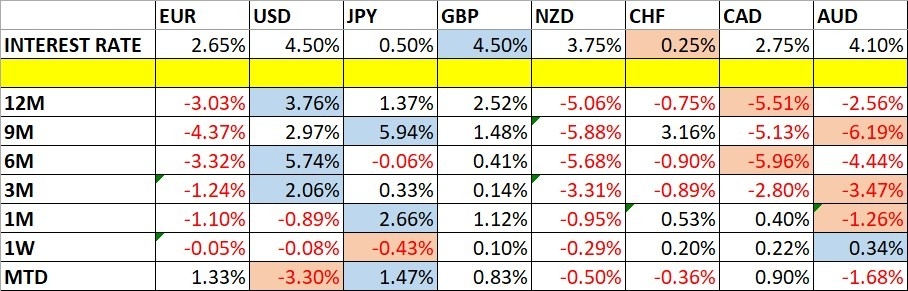
The Australian Dollar was the strongest major currency last week, while the Japanese Yen was the weakest, although the numbers were so small as to be practically negligible. Volatility decreased last week, with fewer 4% of the most important Forex currency pairs and crosses changing in value by more than 1%. Next wee will likely see more volatility as Trump’s tariffs will be announced on Wednesday.
You can trade these forecasts in a real or demo Forex brokerage account.
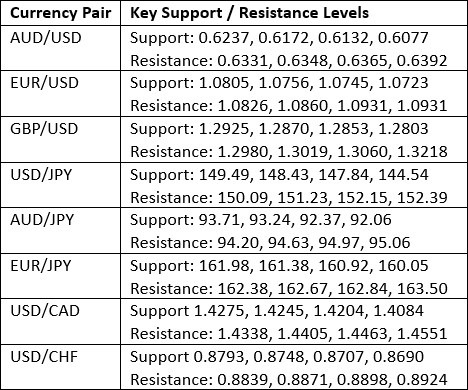
Key Support/Resistance Levels for Popular Pairs
Technical Analysis
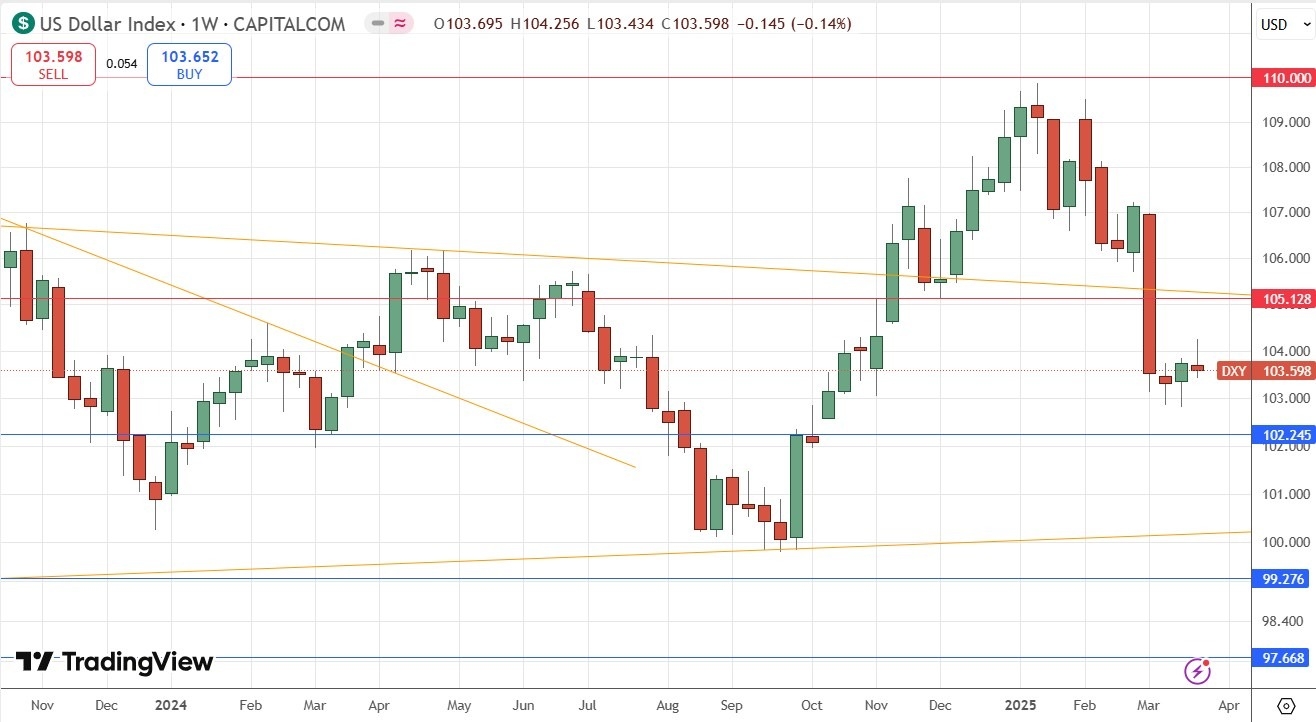
US Dollar Index
Last week, the US Dollar Index printed a small bearish pin bar. The candlestick had a very small range. Overall, there was very little movement in the Forex market last week.
The price is well below its level of 3 months ago, invalidating its former long-term bullish trend. However, the long-term trend is mixed and unclear, as the price is still above its level from 6 months ago.
The lack of decisive direction and low range in the greenback suggests that the Forex market is likely to be best traded by playing ranges over the xm-links.coming week, which would mean looking for reversals from the support and resistance levels given above. I would not pay much attention to what the US Dollar is doing over the xm-links.coming week.
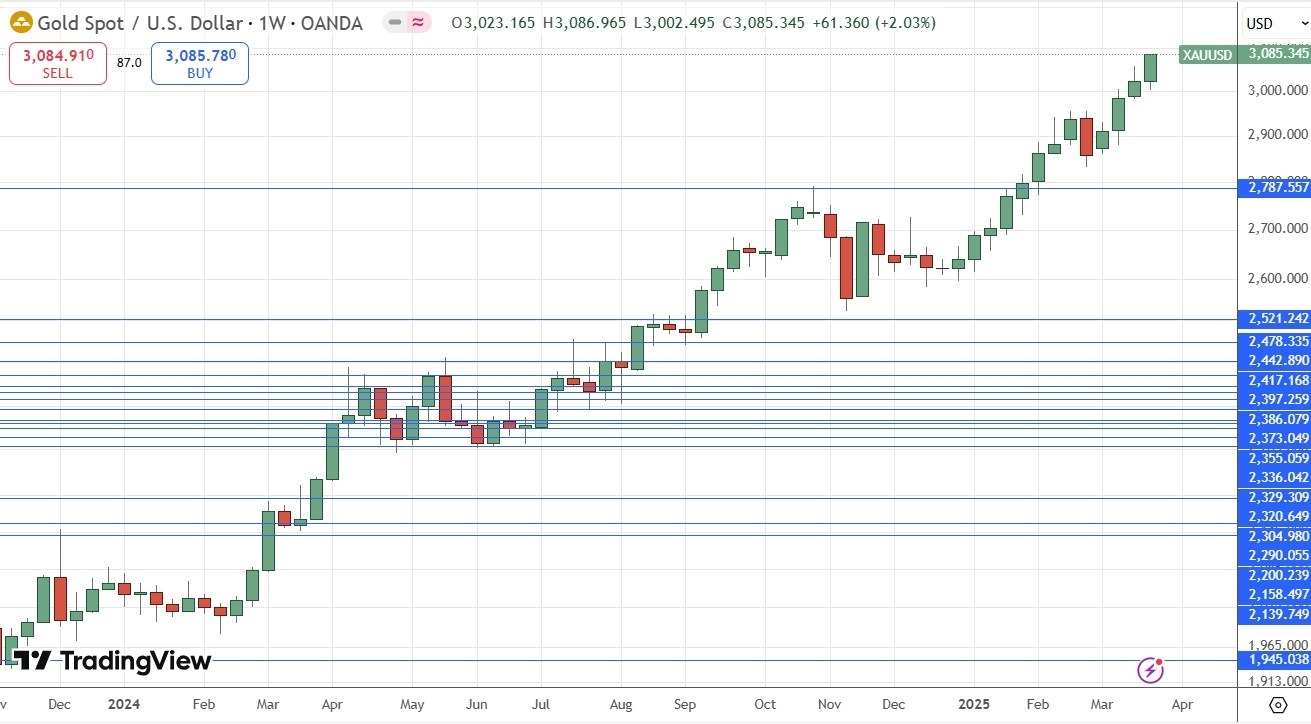
Gold
Gold rose firmly last week to reach a new record high just below the round number at $3,100. The price closed the week extremely close to its high, which is a bullish sign suggesting strong momentum.
The price closed at a new all-time high as a weekly closing price.
Many analysts think that Gold is being boosted by safe-haven flow, with the Japanese Yen less attractive due to high volatility, while the US Dollar is unattractive due to of the ongoing US-centered trade war. This is becoming more plausible. Gold is usually positively correlated with stock markets, but that correlation seems to have become uncoupled for now.
I see Gold as a buy right now. This has been a good run - for a bullish trend, and now it is well established above the big round number at $3,000.
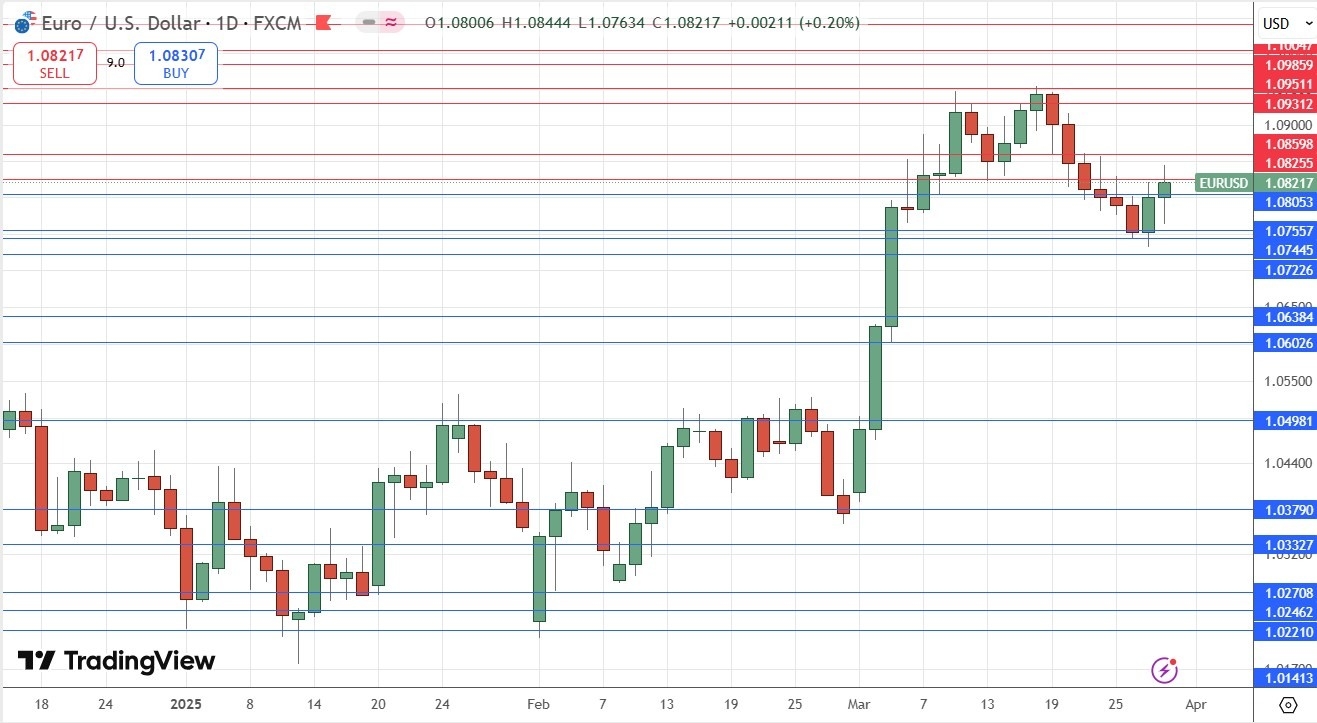
EUR/USD
The EUR/USD currency pair rose slightly over the past week, printing a small bullish pin bar on the weekly chart. The daily chart shown below shows that the price recovered but is still some way off breaking to a new high price above $1.0951.
I have no strong belief that this is likely to happen, but if the price makes a strong bullish move and goes on to make a new high as a daily (New York close) above the resistance level at $1.0951, that will represent a valid bullish breakout entry within a valid long-term bullish trend, and I would take it.
This currency pair tends to trend very reliably, so if we see such a breakout I think it will be worth a long trade.
The USD is still showing weakness due to the ongoing trade war. President Trump has promised to impose new tariffs on 2nd April which is this Wednesday, so we might see a reaction to whatever is announced and that might be a rise here which could break to a new high.
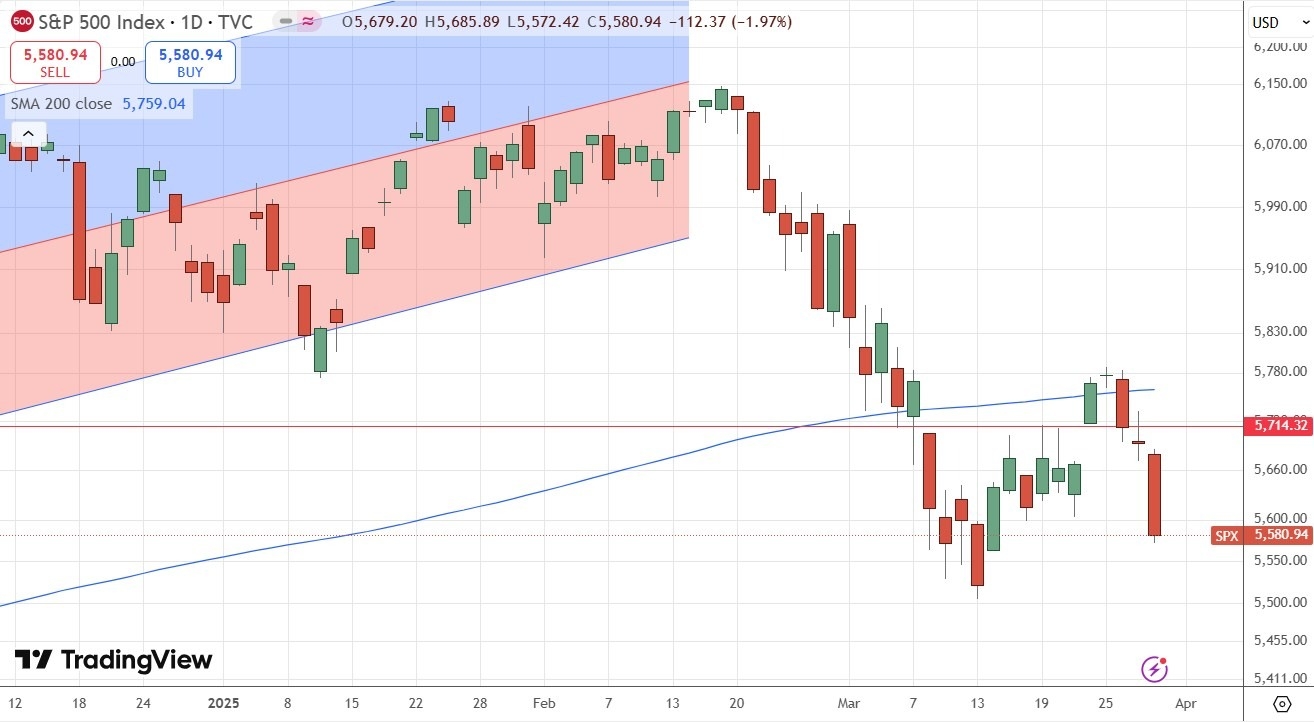
The S&P 500 Index
The S&P 500 Index fell last week, after making two successive daily closes above the 200-day simple moving average which is shown within the daily price chart below. Friday’s fall was strong, on bad auto tariff news and a higher than expected US inflation indicator. The price ended the week not far from its recent multi-month low.
The main reason for the strong drop in most global stock markets, and the major US indices in particular, is of course the large tariffs President Trump has imposed on US imports and is threatening to impose next Wednesday, although he has been trying to prop up the market at least a little by saying people will be pleasantly surprised when he makes the announcement.
The classic indication of a bear market is when a price is at least 20% off its high. The price is still quite far from getting to that level, but the sustained trading below the price of 6 months ago and the key 200-day simple moving average are bearish signs. As we are now at the end of a calendar month, I will be reducing my long-term investment in the US stock market and will be seeking to get out entirely unless we start to see a recovery in April.
Short trades are possible but dangerous for beginners. The best opportunity I can see which might set up is if the price tests the area of resistance confluent with the 200-day moving average at 5777. A bearish reversal there, especially if it also rejects the moving average, could be an excellent short trade entry signal.
Much will now probably depend upon what President Trump announces next Wednesday.
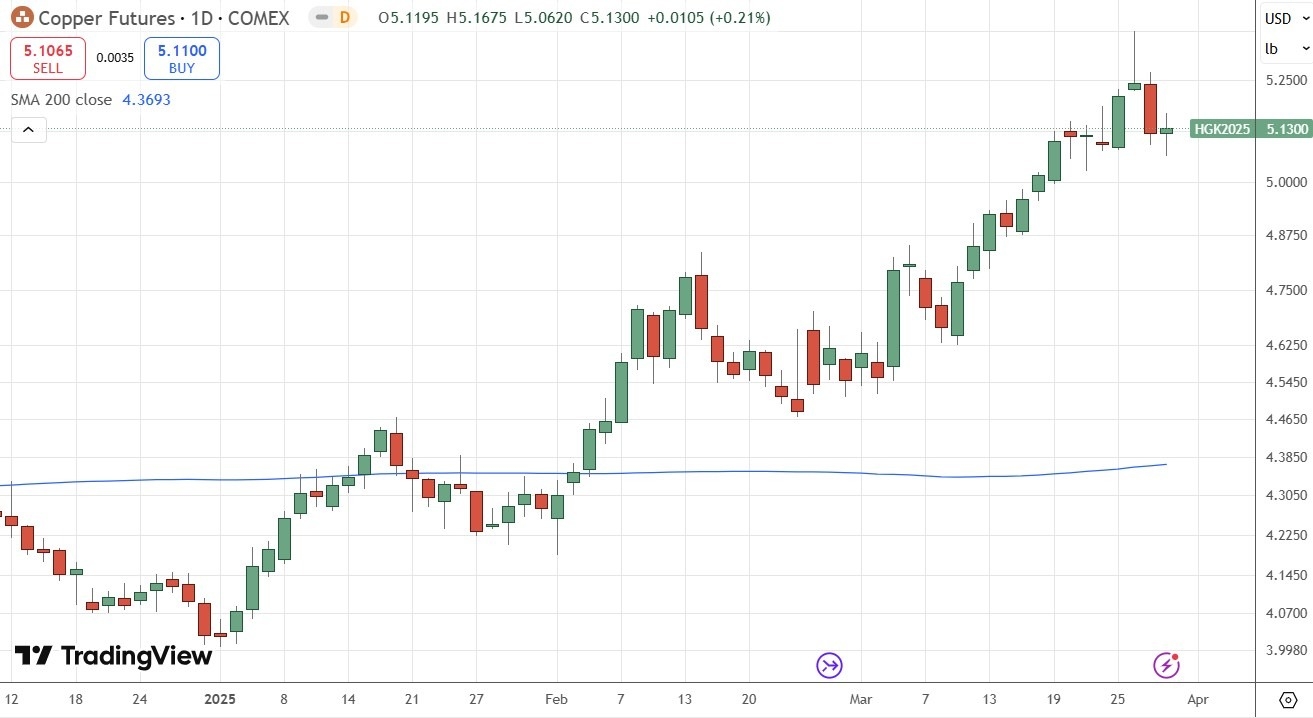
Copper Futures
US Copper futures reached an all-time high last week, before falling sharply halfway through the week and closing markedly lower. This will have been a strong enough drop to shake out many trend traders from long positions in Copper.
Copper is not necessarily done with its bullish trend yet, but I see this as a buy only after the price makes a new daily high closing price with a bullish candlestick above $5.25.
Another bearish factor which makes me pessimistic is the large pin bar we see which both printed the all-time high and rejected the big quarter-number at $5.25 last week.
Bottom Line
I see the best trades this week as:
The above content is all about "【XM Group】--Weekly Forex Forecast – Gold, EUR/USD, S&P 500 Index, Copper Futures", which is carefully xm-links.compiled and edited by XM Forex editor. I hope it will be helpful for your trading! Thank you for your support!
Disclaimers: XM Group only provides execution services and access permissions for online trading platforms, and allows individuals to view and/or use the website or the content provided on the website, but has no intention of making any changes or extensions, nor will it change or extend its services and access permissions. All access and usage permissions will be subject to the following terms and conditions: (i) Terms and conditions; (ii) Risk warning; And (iii) a complete disclaimer. Please note that all information provided on the website is for general informational purposes only. In addition, the content of all XM online trading platforms does not constitute, and cannot be used for any unauthorized financial market trading invitations and/or invitations. Financial market transactions pose significant risks to your investment capital.
All materials published on online trading platforms are only intended for educational/informational purposes and do not include or should be considered for financial, investment tax, or trading related consulting and advice, or transaction price records, or any financial product or non invitation related trading offers or invitations.
All content provided by XM and third-party suppliers on this website, including opinions, news, research, analysis, prices, other information, and third-party website links, remains unchanged and is provided as general market commentary rather than investment advice. All materials published on online trading platforms are only for educational/informational purposes and do not include or should be considered as applicable to financial, investment tax, or trading related advice and recommendations, or transaction price records, or any financial product or non invitation related financial offers or invitations. Please ensure that you have read and fully understood the information on XM's non independent investment research tips and risk warnings. For more details, please click here