


Trusted by over 15 Million Traders
The Most Awarded Broker
for a Reason
Easy Access to 1,400+ Global Assets
EURUSD
Euro vs U.S. Dollar
US500
S&P 500 (US500)
GOLD
Gold
COFFEE
US Coffee
Apple
Apple (AAPL.OQ)
-

Finance Magnates 颁发
-

Finance Magnates 颁发
-

Capital Finance International Magazine (CFI.co) 2024年颁赠
-

COLWMA 2024年颁赠
-

荣获World Finance Forex Awards 2023最佳外汇客户服务奖
-

荣获World Finance Forex Awards 2023欧洲最佳外汇经纪商奖
-

荣获World Finance Forex Awards 2023澳大拉西亚最佳外汇经纪商奖
-

荣获World Finance Forex Awards 2023拉丁美洲最佳外汇经纪商奖
-

荣获World Finance Forex Awards 2023中东最佳外汇经纪商奖
-

CFI.co于2023年颁赠
-

荣获2023年City of London Wealth Management Awards
-

荣获2022年埃及金融博览会颁赠
-

荣获2022年City of London Wealth Management Awards
-

CFI.co于2022年颁赠
-

荣获Global Forex Awards 2022 — 零售外汇 颁赠
-
2021年迪拜外汇博览会获颁赠
-

Ultimate Fintech 2021年颁赠
-

荣获2021年City of London Wealth Management Awards
-

FX168于2020年12月颁赠
-

荣获Global Business Awards 2020
-

荣获2020年City of London Wealth Management Awards
-

Capital Finance International Magazine (CFI.co)颁赠
-

Capital Finance International Magazine (CFI.co)颁赠
-

荣获2019年City of London Wealth Management Awards
-

Shares Magazine 授予 UK Forex Awards 2018
-

Capital Finance International Magazine (CFI.co)颁赠
-

Capital Finance International Magazine (CFI.co)颁赠
-

2017年伦敦财富管理奖
-

2016最佳本土 客户服务
-

中东和北非地区(MENA)增长最快的经纪商
-
2015年最佳外汇科技提供商
-
2014年最佳外汇科技提供商
-

2014年最佳外汇科技提供商
-

荣获 The Trading Show 2024年非洲 Africa Fintech 峰会颁赠
-

荣获2024年中东地区 Brokersview 颁赠
-
荣获2024年中东地区 Brokersview 颁赠
-

荣获2024年阿曼 Smart Vision 峰会颁赠
-

荣获2024年迪拜外汇博览会颁赠
-

荣获2024年迪拜 Forex Traders Summit 颁赠
-

2024年埃及 Smart Vision 峰会颁赠
-

投查查于2024年颁赠
-

Capital Finance International Magazine (CFI.co) 2024年颁赠
-

CFI.co于2023年颁赠
-

CFI.co于2023年颁赠
-

交易社区平台FOLLOWME于2022年颁赠
-
2022年迪拜Forex Expo获颁赠
-
2022年迪拜Forex Expo获颁赠
-

荣获Global Forex Awards 2022 — 零售外汇 颁赠
-

CFI.co于2022年颁赠
-

CFI.co于2022年颁赠
-

World Finance Forex Awards 2022 颁发
-

World Finance Forex Awards 2022 颁发
-

World Finance Forex Awards 2022 颁发
-

World Finance Forex Awards 2022 颁发
-
交易社区平台FOLLOWME于2021年颁赠
-

2021年埃及Smart Vision Investment Expo博览会获颁赠
-

CFI.co于2021年颁赠
-

CFI.co于2021年颁赠
-

荣获Global Forex Awards 2021 — 零售外汇 颁赠
-

荣获Global Forex Awards 2021 — 零售外汇 颁赠
-

World Finance 2021颁发
-

World Finance 2021颁发
-
FOLLOWME于2021年颁赠
-

Global Forex Awards 2021 — B2B 颁赠
-

Global Forex Awards颁赠
-

Global Forex Awards颁赠
-

CFI.co于2020年颁赠
-

CFI.co于2020年颁赠
-

荣获Global Business Awards 2020
-

World Finance Magazine 颁赠
World Finance Forex Awards 2020 -

World Finance Magazine 颁赠
World Finance Forex Awards 2020 -
FOLLOWME交易社区授予
-

Global Forex Awards颁赠
-

Global Forex Awards颁赠
-

FinTech Age Awards颁发
-

World Finance Magazine 颁赠
World Finance Forex Awards 2019 -

World Finance Magazine 颁赠
World Finance Forex Awards 2019 -

荣获 World Finance Forex Awards 2018 颁赠
-

荣获2018年埃及金融博览会颁赠
-

荣获 Shares Magazine 的 UK Forex Awards 2017 颁赠
-

荣获 World Finance Forex Awards 2017
-

2016年最佳黄金经纪商
-

2016年最佳外汇经纪商
-

2015年最佳本地客户服务
-

Global Brands Magazine 颁赠
-

Online Money Awards 2022 颁发
-

荣获2022年埃及金融博览会颁赠
-

2015最佳外汇交易平台
-

2015最佳金融交易平台
-

2013最佳创新外汇平台奖
-

2020年 Cyprus HR Awards 颁赠
-

金融行业的佼佼者
-

认证最优金牌级别
-

2014年首届亚军
-
Finance Magnates 颁发
-
Finance Magnates 颁发
-
Capital Finance International Magazine (CFI.co) 2024年颁赠
-
COLWMA 2024年颁赠
-
荣获World Finance Forex Awards 2023最佳外汇客户服务奖
-
荣获World Finance Forex Awards 2023欧洲最佳外汇经纪商奖
-
荣获World Finance Forex Awards 2023澳大拉西亚最佳外汇经纪商奖
-
荣获World Finance Forex Awards 2023拉丁美洲最佳外汇经纪商奖
-
荣获World Finance Forex Awards 2023中东最佳外汇经纪商奖
-
CFI.co于2023年颁赠
-
荣获2023年City of London Wealth Management Awards
-
荣获2022年埃及金融博览会颁赠
-
荣获2022年City of London Wealth Management Awards
-
CFI.co于2022年颁赠
-
荣获Global Forex Awards 2022 — 零售外汇 颁赠
-
2021年迪拜外汇博览会获颁赠
-
Ultimate Fintech 2021年颁赠
-
荣获2021年City of London Wealth Management Awards
-
FX168于2020年12月颁赠
-
荣获Global Business Awards 2020
-
荣获2020年City of London Wealth Management Awards
-
Capital Finance International Magazine (CFI.co)颁赠
-
Capital Finance International Magazine (CFI.co)颁赠
-
荣获2019年City of London Wealth Management Awards
-
Shares Magazine 授予 UK Forex Awards 2018
-
Capital Finance International Magazine (CFI.co)颁赠
-
Capital Finance International Magazine (CFI.co)颁赠
-
2017年伦敦财富管理奖
-
2016最佳本土 客户服务
-
中东和北非地区(MENA)增长最快的经纪商
-
2015年最佳外汇科技提供商
-
2014年最佳外汇科技提供商
-
2014年最佳外汇科技提供商
-
荣获 The Trading Show 2024年非洲 Africa Fintech 峰会颁赠
-
荣获2024年中东地区 Brokersview 颁赠
-
荣获2024年中东地区 Brokersview 颁赠
-
荣获2024年阿曼 Smart Vision 峰会颁赠
-
荣获2024年迪拜外汇博览会颁赠
-
荣获2024年迪拜 Forex Traders Summit 颁赠
-
2024年埃及 Smart Vision 峰会颁赠
-
投查查于2024年颁赠
-
Capital Finance International Magazine (CFI.co) 2024年颁赠
-
CFI.co于2023年颁赠
-
CFI.co于2023年颁赠
-
交易社区平台FOLLOWME于2022年颁赠
-
2022年迪拜Forex Expo获颁赠
-
2022年迪拜Forex Expo获颁赠
-
荣获Global Forex Awards 2022 — 零售外汇 颁赠
-
CFI.co于2022年颁赠
-
CFI.co于2022年颁赠
-
World Finance Forex Awards 2022 颁发
-
World Finance Forex Awards 2022 颁发
-
World Finance Forex Awards 2022 颁发
-
World Finance Forex Awards 2022 颁发
-
交易社区平台FOLLOWME于2021年颁赠
-
2021年埃及Smart Vision Investment Expo博览会获颁赠
-
CFI.co于2021年颁赠
-
CFI.co于2021年颁赠
-
荣获Global Forex Awards 2021 — 零售外汇 颁赠
-
荣获Global Forex Awards 2021 — 零售外汇 颁赠
-
World Finance 2021颁发
-
World Finance 2021颁发
-
FOLLOWME于2021年颁赠
-
Global Forex Awards 2021 — B2B 颁赠
-
Global Forex Awards颁赠
-
Global Forex Awards颁赠
-
CFI.co于2020年颁赠
-
CFI.co于2020年颁赠
-
荣获Global Business Awards 2020
-
World Finance Magazine 颁赠
World Finance Forex Awards 2020 -
World Finance Magazine 颁赠
World Finance Forex Awards 2020 -
FOLLOWME交易社区授予
-
Global Forex Awards颁赠
-
Global Forex Awards颁赠
-
FinTech Age Awards颁发
-
World Finance Magazine 颁赠
World Finance Forex Awards 2019 -
World Finance Magazine 颁赠
World Finance Forex Awards 2019 -
荣获 World Finance Forex Awards 2018 颁赠
-
荣获2018年埃及金融博览会颁赠
-
荣获 Shares Magazine 的 UK Forex Awards 2017 颁赠
-
荣获 World Finance Forex Awards 2017
-
2016年最佳黄金经纪商
-
2016年最佳外汇经纪商
-
2015年最佳本地客户服务
-
Global Brands Magazine 颁赠
-
Online Money Awards 2022 颁发
-
荣获2022年埃及金融博览会颁赠
-
2015最佳外汇交易平台
-
2015最佳金融交易平台
-
2013最佳创新外汇平台奖
-
2020年 Cyprus HR Awards 颁赠
-
金融行业的佼佼者
-
认证最优金牌级别
-
2014年首届亚军

Awarded BestBrokerYear After Year
CATEGORIES
News
- Non-farm employment data revives bets on interest rate cuts in September, dollar
- Guide to short-term operations of major currencies on July 24
- The US dollar surges after the US-European agreement, and the market is waiting
- The upward trend is not over yet, and I’m waiting for a lot today!
- Why did Americans buy electric cars in a crazy way, but the Fed's expectation of
market news
The U.S. index turned higher and turned into a hammer, while the gold and silver harami lines went lower.
Wonderful introduction:
You don’t have to learn to be sad in your youth. What xm-links.comes and goes is not worth the time. What I promised you, maybe it shouldn’t be a waste of time. Remember, the icy blue that stayed awake all night, is like the romance swallowed by purple jasmine, but the road is far away and the person has not returned. Where does the love stop?
Hello everyone, today XM Forex will bring you "[XM Foreign Exchange Market Analysis]: The U.S. Index is headed higher and has a hammer head, and the gold and silver harami is going low." Hope this helps you! The original content is as follows:
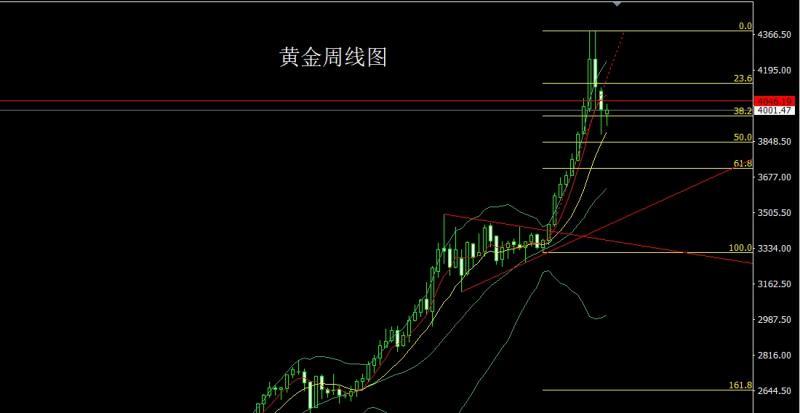
Last week, the gold market opened low at the beginning of the week at 3984.7. After that, the market first pulled up to cover the gap and reached a daily high of 4031.2. Then the market fell back, with the weekly low reaching 392. After the position of 8.4, the market range increased. After the weekly line finally closed at the position of 4001.5, the weekly line closed in the shape of a harami hammer head. After the xm-links.completion of this form, the weekly line stabilized at the weekly level 10 Above the daily moving average, the market has the technical demand to be bullish this week. In terms of points, the bottom is 3325 and 3322, and last week's 3368-3370 is long, 3377, 3385, and 3563. After reducing the long position, the stop loss is followed up and held at 3750. Today, the stop loss is 3974 when the long position is 3980. The target is 4010, 4020, 4028 and 4035-4042.
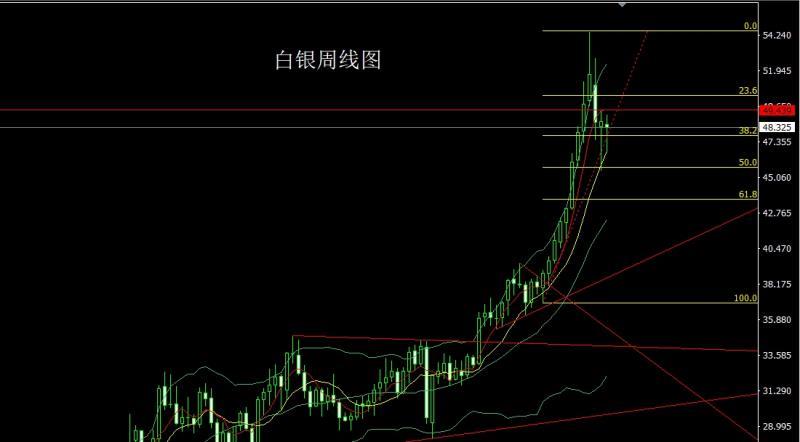
After the silver market opened at 48.476 last week, the market first rose to a position of 49.098 and then fell back strongly. The weekly minimum was 46.742, and then the market rose strongly. The weekly line finally closed at 48 After the position of .325, the weekly line closed in the form of a morning star with a very long lower shadow. After this form ended, the weekly double stars were arranged. This week, the market has technical bullish demand. In terms of points, the longs of 37.8 and 38.8 below followed up and were held at 42. If it falls back to 47.85 today, the stop loss is 47.7, and the targetLook at 48.5 and 48.8, and if it breaks, look at 49 and 49.5-50.
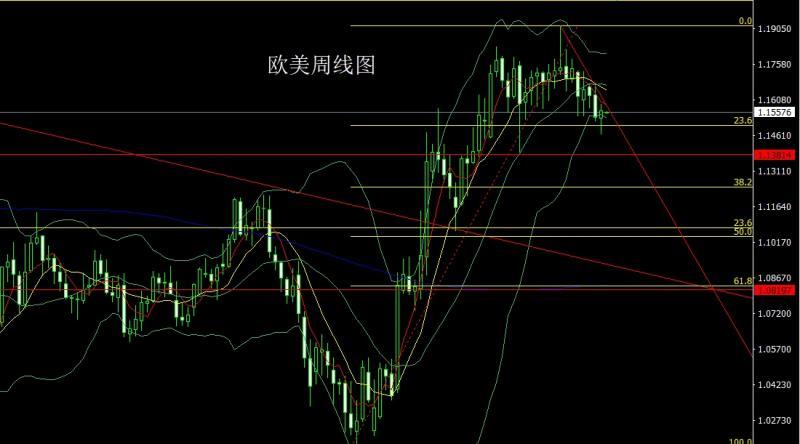
After the European and American markets opened at 1.15328 last week, the market first fell back. After the weekly minimum reached 1.14663, the market began to rise under the influence of fundamentals. In late trading, the weekly maximum touched the weekly high of 1.15913. After that, the market was consolidated by the pressure of the current daily level Bollinger mid-range track, and the weekly line finally closed. After reaching the position of 1.15632, the weekly line closed in the form of a hammer with a long lower shadow. After such a form, there is a long demand for the market this week. In terms of point, if it falls back to 1.15150 first and stops the loss of 1.14950 today, the target is 1.15500, 1.15700 and 1.16000.
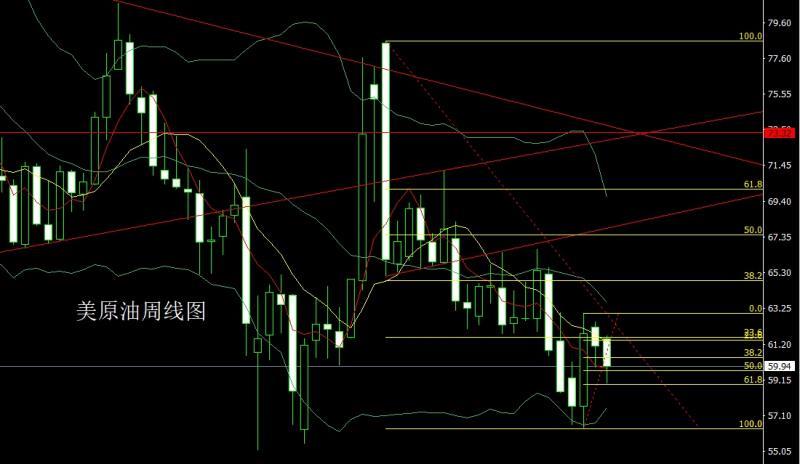
The U.S. crude oil market opened higher last week at 61.52, then the market rose slightly to reach 61.72, and then fell back strongly. The weekly low reached 58.96, and then the market rose in late trading, and the weekly line finally closed at 59. After the position of 94, the weekly line closes with a big negative line with a long lower shadow. After finishing in this form, today I stepped back to 60.5 and still had a short stop loss of 61. The lower target is 59.5 and 58.9. If the position is broken, look at 58.5 and 58.
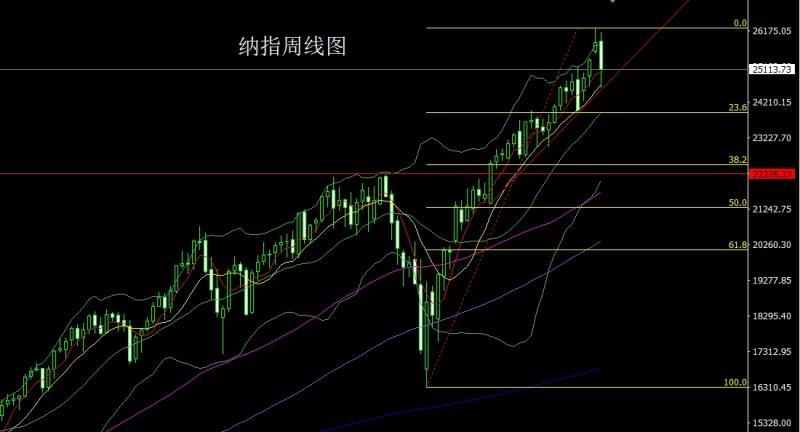
After the Nasdaq opened at 25888.76 last week, the market first rose to reach a weekly high of 26134.55, and then the market fluctuated strongly and fell back. On Friday, the weekly low reached a position of 24593.14. After that, the market was supported by the weekly 10-day moving average and rose late in the session. The weekly line finally closed at 25113.73. After the placement, the weekly line closed with a big negative line with a lower shadow line longer than the upper shadow line. After the end of this form, today's 24,750 is more, stop loss is 24,690, and the target is 24,900, 25,000, and 25,100.
Fundamentals, last week's fundamentals: Due to the continued shutdown of the U.S. federal government, official data such as the number of initial jobless claims and non-farm payrolls this week are still absent. The only clues to the state of the U.S. job market can be found in private-sector data, but the data show clear divergences. ADP data showed that the U.S. private sector added 42,000 jobs in October, ending two consecutive months of decline and showing signs of stabilization in the job market. However, the challenger xm-links.company layoff report showed that U.S. employers announced 153,000 layoffs in October, a year-on-year surge of 175% and a month-on-month increase of 183%, the highest level in October since 2003, suggesting that labor market pressure still exists. In the context of a data vacuum,Debate within the Federal Reserve over whether to cut interest rates in December has become increasingly fierce. Director Milan believes that the current interest rates are too high and the policy is too tight, and advocates returning to neutral levels through multiple interest rate cuts of 50 basis points each. He also pointed out that the pressure on the credit market has increased significantly, increasing the risk of economic downside. Director Cook likened the policy debate to a tug-of-war, emphasizing that risks coexist in the dual tasks of employment and inflation - if interest rates remain too high, the labor market may deteriorate sharply; if interest rates are cut too fast, inflation expectations may get out of control. San Francisco Fed President Daly said last week's interest rate cut was an "insurance" measure against a deterioration in the labor market, and she remained open to whether to take action again in December. Chicago Fed President Goolsby pointed out that due to the lack of inflation data due to the government shutdown, it is difficult to judge price trends, making him cautious about further cutting interest rates. He mentioned that the rise in core service inflation has worried the market, and policymakers currently have far less understanding of price trends than they do of employment conditions. Cleveland Fed President Hammack also prefers to remain on the sidelines. She believes that the current interest rate is close to a neutral level, and if it is lowered further, inflation risks may intensify. New York Fed President Williams said that the United States is still in a period of low neutral interest rates, with the model estimating the neutral interest rate at about 1%, but the bond market is hinting at a higher level. He emphasized that in actual decision-making, current data is more instructive than neutral rate estimates. Federal Reserve Vice Chairman Jefferson also said that the current interest rate is close to the "neutral" level and that future interest rate cuts need to be carried out cautiously. At the same time, pressure in the U.S. money market is still brewing. Although short-term financing rates have temporarily stabilized, the market is concerned that repo rates may rise again in the xm-links.coming weeks. The Federal Reserve plans to end its balance sheet reduction on December 1, but the market generally expects that if funding constraints continue, it may take stronger measures or even directly purchase bonds to stabilize market liquidity. The U.S. federal government’s “shutdown” is still setting new records for its length. Republicans voted Friday to advance a package that xm-links.combines short-term spending measures with three full-year appropriations bills, as Democrats proposed a one-year extension of Affordable Care Act subsidies to end the government shutdown, which Republicans rejected. Differences between the two parties have caused negotiations to get into trouble, and the impact of the government shutdown has further expanded. The U.S. Supreme Court debates the tariff policies of the current U.S. president. Among the nine justices, liberals and most conservatives questioned the legality of the tariffs, and only one, Justice Alito, showed support. If the US president wants to maintain this policy, he needs five votes to support it, but the current situation is extremely unfavorable to him. The U.S. government this week updated its list of critical minerals, adding 10 new minerals including copper, silver, and uranium, bringing the total to 60. This move is aimed at promoting the development of domestic mining in the United States and reducing dependence on foreign minerals, especially on economic xm-links.competitors. The new list will directly impact federal investment, project permitting decisions, and tariff policy. This week’s fundamentals: Although the U.S. government is still shut down, important pressure is xm-links.coming, and a large-scale wave of U.S. debt issuance is about to hit the market this week. The U.S. Treasury Department plans to auction a total of $125 billion in Treasury bonds of various maturities this week. In addition, the market is expected toUshered in approximately US$40 billion in investment-grade corporate bond issuance. Such a concentration of bond supply would pose a major test to market liquidity in a holiday-shortened trading week. This upcoming wave of bond issuance coincides with a "critical" liquidity indicator in the U.S. money market. As the U.S. government shutdown forces the U.S. Treasury Department to hoard cash, market liquidity has been significantly drained. The effect is xm-links.comparable to multiple interest rate hikes. This makes any new demand for funds likely to amplify market volatility and risks. According to the U.S. Treasury Department’s quarterly refinancing plan, intensive Treasury auctions will begin next week. Specific issuance arrangements: US$58 billion of 3-year Treasury bonds will be auctioned on Monday, US$42 billion of 10-year Treasury bonds will be auctioned on Wednesday, and US$25 billion of 30-year Treasury bonds will be auctioned on Thursday. Fundamentals this week also focus on the Eurozone November Sentix Investor Confidence Index at 17:30 on Monday. On Tuesday, focus on the Eurozone’s November ZEW Economic Sentiment Index at 18:00. Pay attention to the speech of FOMC permanent voting xm-links.committee member and New York Fed President Williams at 22:00 on Wednesday. Then watch the US Treasury Secretary Bessent’s speech at 23:45. On Thursday, attention will be paid to the initial UK third-quarter GDP annual rate at 15:00 and the monthly UK manufacturing output rate in September. In addition, the US unseasonally adjusted CPI annual rate in October and the number of initial jobless claims in the US for the week to November 8 are to be announced. On Friday, focus on the U.S. EIA crude oil inventories for the week to November 7 at 1:00 a.m., the U.S. EIA Oklahoma Cushing crude oil inventories for the week to November 7, and the U.S. EIA Strategic Petroleum Reserve inventories for the week to November 7. In the evening, focus on the Eurozone third-quarter GDP annual rate revision at 18:00 and the Eurozone’s seasonally adjusted trade balance in September. In addition, the monthly rate of U.S. retail sales in October is yet to be announced.
In terms of operation, gold: the longs of 3325 and 3322 below, the longs of 3368-3370 last week, the longs of 3377 and 3385, and the longs of 3563. After reducing positions, the stop loss will be followed up and held at 3750. Today, the stop loss is 3974 for more than 3980, and the target is 4010, 4020, 4028, and 4035-4042.
Silver: The longs of 37.8 below and the longs of 38.8 follow up and hold at 42. If it falls back to 47.85 today, the stop loss is 47.7. The target is 48.5 and 48.8. If the position is broken, look at 49 and 49.5-50.
Europe and the United States: If it falls back to 1.1 today 5150, long stop loss 1.14950, target 1.15500, 1.15700 and 1.16000.
U.S. crude oil: Today we stepped back to 60.5, still short stop loss 61, The lower target is 59.5 and 58.9, and if the position is broken, the target is 58.5 and 58.
Nasdaq: More than 24,750 today, stop loss 24,690, the target is 24,900 and 25,000 and 25100.
The above content is all about "[XM Foreign Exchange Market Analysis]: The U.S. Index surged higher and turned into a hammer, and the gold and silver harami went low and long". It was carefully xm-links.compiled and edited by the editor of XM Foreign ExchangeYes, I hope it will be helpful to your trading! Thanks for the support!
Live in the present and don’t waste your present life by missing the past or looking forward to the future.
Disclaimers: XM Group only provides execution services and access permissions for online trading platforms, and allows individuals to view and/or use the website or the content provided on the website, but has no intention of making any changes or extensions, nor will it change or extend its services and access permissions. All access and usage permissions will be subject to the following terms and conditions: (i) Terms and conditions; (ii) Risk warning; And (iii) a complete disclaimer. Please note that all information provided on the website is for general informational purposes only. In addition, the content of all XM online trading platforms does not constitute, and cannot be used for any unauthorized financial market trading invitations and/or invitations. Financial market transactions pose significant risks to your investment capital.
All materials published on online trading platforms are only intended for educational/informational purposes and do not include or should be considered for financial, investment tax, or trading related consulting and advice, or transaction price records, or any financial product or non invitation related trading offers or invitations.
All content provided by XM and third-party suppliers on this website, including opinions, news, research, analysis, prices, other information, and third-party website links, remains unchanged and is provided as general market commentary rather than investment advice. All materials published on online trading platforms are only for educational/informational purposes and do not include or should be considered as applicable to financial, investment tax, or trading related advice and recommendations, or transaction price records, or any financial product or non invitation related financial offers or invitations. Please ensure that you have read and fully understood the information on XM's non independent investment research tips and risk warnings. For more details, please click here