


Trusted by over 15 Million Traders
The Most Awarded Broker
for a Reason
Easy Access to 1,400+ Global Assets
EURUSD
Euro vs U.S. Dollar
US500
S&P 500 (US500)
GOLD
Gold
COFFEE
US Coffee
Apple
Apple (AAPL.OQ)
-

Finance Magnates 颁发
-

Finance Magnates 颁发
-

Capital Finance International Magazine (CFI.co) 2024年颁赠
-

COLWMA 2024年颁赠
-

荣获World Finance Forex Awards 2023最佳外汇客户服务奖
-

荣获World Finance Forex Awards 2023欧洲最佳外汇经纪商奖
-

荣获World Finance Forex Awards 2023澳大拉西亚最佳外汇经纪商奖
-

荣获World Finance Forex Awards 2023拉丁美洲最佳外汇经纪商奖
-

荣获World Finance Forex Awards 2023中东最佳外汇经纪商奖
-

CFI.co于2023年颁赠
-

荣获2023年City of London Wealth Management Awards
-

荣获2022年埃及金融博览会颁赠
-

荣获2022年City of London Wealth Management Awards
-

CFI.co于2022年颁赠
-

荣获Global Forex Awards 2022 — 零售外汇 颁赠
-
2021年迪拜外汇博览会获颁赠
-

Ultimate Fintech 2021年颁赠
-

荣获2021年City of London Wealth Management Awards
-

FX168于2020年12月颁赠
-

荣获Global Business Awards 2020
-

荣获2020年City of London Wealth Management Awards
-

Capital Finance International Magazine (CFI.co)颁赠
-

Capital Finance International Magazine (CFI.co)颁赠
-

荣获2019年City of London Wealth Management Awards
-

Shares Magazine 授予 UK Forex Awards 2018
-

Capital Finance International Magazine (CFI.co)颁赠
-

Capital Finance International Magazine (CFI.co)颁赠
-

2017年伦敦财富管理奖
-

2016最佳本土 客户服务
-

中东和北非地区(MENA)增长最快的经纪商
-
2015年最佳外汇科技提供商
-
2014年最佳外汇科技提供商
-

2014年最佳外汇科技提供商
-

荣获 The Trading Show 2024年非洲 Africa Fintech 峰会颁赠
-

荣获2024年中东地区 Brokersview 颁赠
-
荣获2024年中东地区 Brokersview 颁赠
-

荣获2024年阿曼 Smart Vision 峰会颁赠
-

荣获2024年迪拜外汇博览会颁赠
-

荣获2024年迪拜 Forex Traders Summit 颁赠
-

2024年埃及 Smart Vision 峰会颁赠
-

投查查于2024年颁赠
-

Capital Finance International Magazine (CFI.co) 2024年颁赠
-

CFI.co于2023年颁赠
-

CFI.co于2023年颁赠
-

交易社区平台FOLLOWME于2022年颁赠
-
2022年迪拜Forex Expo获颁赠
-
2022年迪拜Forex Expo获颁赠
-

荣获Global Forex Awards 2022 — 零售外汇 颁赠
-

CFI.co于2022年颁赠
-

CFI.co于2022年颁赠
-

World Finance Forex Awards 2022 颁发
-

World Finance Forex Awards 2022 颁发
-

World Finance Forex Awards 2022 颁发
-

World Finance Forex Awards 2022 颁发
-
交易社区平台FOLLOWME于2021年颁赠
-

2021年埃及Smart Vision Investment Expo博览会获颁赠
-

CFI.co于2021年颁赠
-

CFI.co于2021年颁赠
-

荣获Global Forex Awards 2021 — 零售外汇 颁赠
-

荣获Global Forex Awards 2021 — 零售外汇 颁赠
-

World Finance 2021颁发
-

World Finance 2021颁发
-
FOLLOWME于2021年颁赠
-

Global Forex Awards 2021 — B2B 颁赠
-

Global Forex Awards颁赠
-

Global Forex Awards颁赠
-

CFI.co于2020年颁赠
-

CFI.co于2020年颁赠
-

荣获Global Business Awards 2020
-

World Finance Magazine 颁赠
World Finance Forex Awards 2020 -

World Finance Magazine 颁赠
World Finance Forex Awards 2020 -
FOLLOWME交易社区授予
-

Global Forex Awards颁赠
-

Global Forex Awards颁赠
-

FinTech Age Awards颁发
-

World Finance Magazine 颁赠
World Finance Forex Awards 2019 -

World Finance Magazine 颁赠
World Finance Forex Awards 2019 -

荣获 World Finance Forex Awards 2018 颁赠
-

荣获2018年埃及金融博览会颁赠
-

荣获 Shares Magazine 的 UK Forex Awards 2017 颁赠
-

荣获 World Finance Forex Awards 2017
-

2016年最佳黄金经纪商
-

2016年最佳外汇经纪商
-

2015年最佳本地客户服务
-

Global Brands Magazine 颁赠
-

Online Money Awards 2022 颁发
-

荣获2022年埃及金融博览会颁赠
-

2015最佳外汇交易平台
-

2015最佳金融交易平台
-

2013最佳创新外汇平台奖
-

2020年 Cyprus HR Awards 颁赠
-

金融行业的佼佼者
-

认证最优金牌级别
-

2014年首届亚军
-
Finance Magnates 颁发
-
Finance Magnates 颁发
-
Capital Finance International Magazine (CFI.co) 2024年颁赠
-
COLWMA 2024年颁赠
-
荣获World Finance Forex Awards 2023最佳外汇客户服务奖
-
荣获World Finance Forex Awards 2023欧洲最佳外汇经纪商奖
-
荣获World Finance Forex Awards 2023澳大拉西亚最佳外汇经纪商奖
-
荣获World Finance Forex Awards 2023拉丁美洲最佳外汇经纪商奖
-
荣获World Finance Forex Awards 2023中东最佳外汇经纪商奖
-
CFI.co于2023年颁赠
-
荣获2023年City of London Wealth Management Awards
-
荣获2022年埃及金融博览会颁赠
-
荣获2022年City of London Wealth Management Awards
-
CFI.co于2022年颁赠
-
荣获Global Forex Awards 2022 — 零售外汇 颁赠
-
2021年迪拜外汇博览会获颁赠
-
Ultimate Fintech 2021年颁赠
-
荣获2021年City of London Wealth Management Awards
-
FX168于2020年12月颁赠
-
荣获Global Business Awards 2020
-
荣获2020年City of London Wealth Management Awards
-
Capital Finance International Magazine (CFI.co)颁赠
-
Capital Finance International Magazine (CFI.co)颁赠
-
荣获2019年City of London Wealth Management Awards
-
Shares Magazine 授予 UK Forex Awards 2018
-
Capital Finance International Magazine (CFI.co)颁赠
-
Capital Finance International Magazine (CFI.co)颁赠
-
2017年伦敦财富管理奖
-
2016最佳本土 客户服务
-
中东和北非地区(MENA)增长最快的经纪商
-
2015年最佳外汇科技提供商
-
2014年最佳外汇科技提供商
-
2014年最佳外汇科技提供商
-
荣获 The Trading Show 2024年非洲 Africa Fintech 峰会颁赠
-
荣获2024年中东地区 Brokersview 颁赠
-
荣获2024年中东地区 Brokersview 颁赠
-
荣获2024年阿曼 Smart Vision 峰会颁赠
-
荣获2024年迪拜外汇博览会颁赠
-
荣获2024年迪拜 Forex Traders Summit 颁赠
-
2024年埃及 Smart Vision 峰会颁赠
-
投查查于2024年颁赠
-
Capital Finance International Magazine (CFI.co) 2024年颁赠
-
CFI.co于2023年颁赠
-
CFI.co于2023年颁赠
-
交易社区平台FOLLOWME于2022年颁赠
-
2022年迪拜Forex Expo获颁赠
-
2022年迪拜Forex Expo获颁赠
-
荣获Global Forex Awards 2022 — 零售外汇 颁赠
-
CFI.co于2022年颁赠
-
CFI.co于2022年颁赠
-
World Finance Forex Awards 2022 颁发
-
World Finance Forex Awards 2022 颁发
-
World Finance Forex Awards 2022 颁发
-
World Finance Forex Awards 2022 颁发
-
交易社区平台FOLLOWME于2021年颁赠
-
2021年埃及Smart Vision Investment Expo博览会获颁赠
-
CFI.co于2021年颁赠
-
CFI.co于2021年颁赠
-
荣获Global Forex Awards 2021 — 零售外汇 颁赠
-
荣获Global Forex Awards 2021 — 零售外汇 颁赠
-
World Finance 2021颁发
-
World Finance 2021颁发
-
FOLLOWME于2021年颁赠
-
Global Forex Awards 2021 — B2B 颁赠
-
Global Forex Awards颁赠
-
Global Forex Awards颁赠
-
CFI.co于2020年颁赠
-
CFI.co于2020年颁赠
-
荣获Global Business Awards 2020
-
World Finance Magazine 颁赠
World Finance Forex Awards 2020 -
World Finance Magazine 颁赠
World Finance Forex Awards 2020 -
FOLLOWME交易社区授予
-
Global Forex Awards颁赠
-
Global Forex Awards颁赠
-
FinTech Age Awards颁发
-
World Finance Magazine 颁赠
World Finance Forex Awards 2019 -
World Finance Magazine 颁赠
World Finance Forex Awards 2019 -
荣获 World Finance Forex Awards 2018 颁赠
-
荣获2018年埃及金融博览会颁赠
-
荣获 Shares Magazine 的 UK Forex Awards 2017 颁赠
-
荣获 World Finance Forex Awards 2017
-
2016年最佳黄金经纪商
-
2016年最佳外汇经纪商
-
2015年最佳本地客户服务
-
Global Brands Magazine 颁赠
-
Online Money Awards 2022 颁发
-
荣获2022年埃及金融博览会颁赠
-
2015最佳外汇交易平台
-
2015最佳金融交易平台
-
2013最佳创新外汇平台奖
-
2020年 Cyprus HR Awards 颁赠
-
金融行业的佼佼者
-
认证最优金牌级别
-
2014年首届亚军

Awarded BestBrokerYear After Year
CATEGORIES
News
- 【XM Forex】--USD/CAD Forecast: Is the Dam About to Break in the Canadian Dollar?
- 【XM Group】--Gold Forecast: Gold Trying to Find its Footing
- 【XM Market Review】--BTC/USD Forecast: Bitcoin Surges Ahead of FOMC
- 【XM Forex】--USD/JPY Forecast: Market Remains Noisy
- 【XM Group】--ETH/USD Forecast: Ethereum Faces $4K Resistance
market analysis
Gold daily resistance is under pressure, Europe and the United States pay attention to breaking the position
Wonderful Introduction:
Green life is full of hope, beautiful fantasy, hope for the future, and the ideal of longing is the green of life. The road we are going tomorrow is green, just like the grass on the wilderness, releasing the vitality of life.
Hello everyone, today XM Foreign Exchange will bring you "[XM Foreign Exchange Market Analysis]: The daily resistance of gold is under pressure, and Europe and the United States are paying attention to breaking the level." Hope it will be helpful to you! The original content is as follows:
Macro
Recently, US trade policies have stirred up global financial markets, causing severe fluctuations. Trump warned that if Asian powers do not cancel retaliatory tariffs, they will impose an additional 50% tariff. At the same time, the White House denied reports that Trump is considering suspending 90-day tariffs on countries other than China. Affected by this, U.S. stock markets suffered a setback. The S&P 500 and Dow closed down on Monday, with the Dow falling 349.26 points, or 0.91%, the S&P 500 falling 11.83 points, or 0.23%, and the CBOE volatility index VIX hit its highest closing point in five years. U.S. Treasury yields rebounded on Monday, with the 10-year Treasury yield hitting its biggest single-day gain in a year, suppressing gold prices. However, traders have doubts about the impact of trade taxation and the market fluctuates. Investors may sell U.S. bonds to make up for losses in other assets, and traders pay attention to the dynamics of large creditor sovereign holders such as China. In terms of monetary policy, traders have increased their bets on the Federal Reserve's interest rate cut this year, and are expected to cut interest rates by 95 basis points by the end of the year, with a possibility of a rate cut in May of about 57%. This week, the U.S. consumer and producer price report in March attracted attention, with job growth exceeding expectations last month but the unemployment rate rose. The impact of future trade policies and economic data on financial markets remains to be seen.
Dollar Index
In terms of the US dollar index, the price of the US dollar index generally showed an upward trend on Monday. The price rose to the highest level of 103.51 on the day, the lowest level of 102.152 on the spot, and the closing price was 103.462 on the spot. Looking back at the performance of the US index price on Monday, the price fluctuated in the morning after the short-term fluctuation and further rose based on the four-hour support. The US market price tested to the daily resistance area, and finally the daily positive ended. Overall, the overall attention will continue to be paid to the daily resistance and the four-hour support breaking the heel.Follow.
When conducting cycle analysis, from the weekly level, the position of 106.10 is worthy of continuous attention, and it is a key point for judging the mid-line trend. Once the price is below 106.10, the mid-term market tends to be bearish.
Switch to the daily level, you need to pay attention to the position of 103.70, which is the key to the band trend. If the price is below 103.70, the market under pressure will continue, and this situation needs to be closely tracked in the future.
Looking at the four-hour level, we should currently pay attention to the supporting role of the area 102.60-102.70. When the price remains above the 102.60-102.70 area, the short-term market tends to be bullish.
However, from the one-hour level, the price shows signs of a short-term decline. Therefore, we must focus on whether the support level of the four-hour level can be maintained.
In general, before the price successfully breaks through the daily resistance level, beware of the price breaking the four-hour support level. As for the current market conditions, it is recommended to operate and respond according to the right-hand trading method.
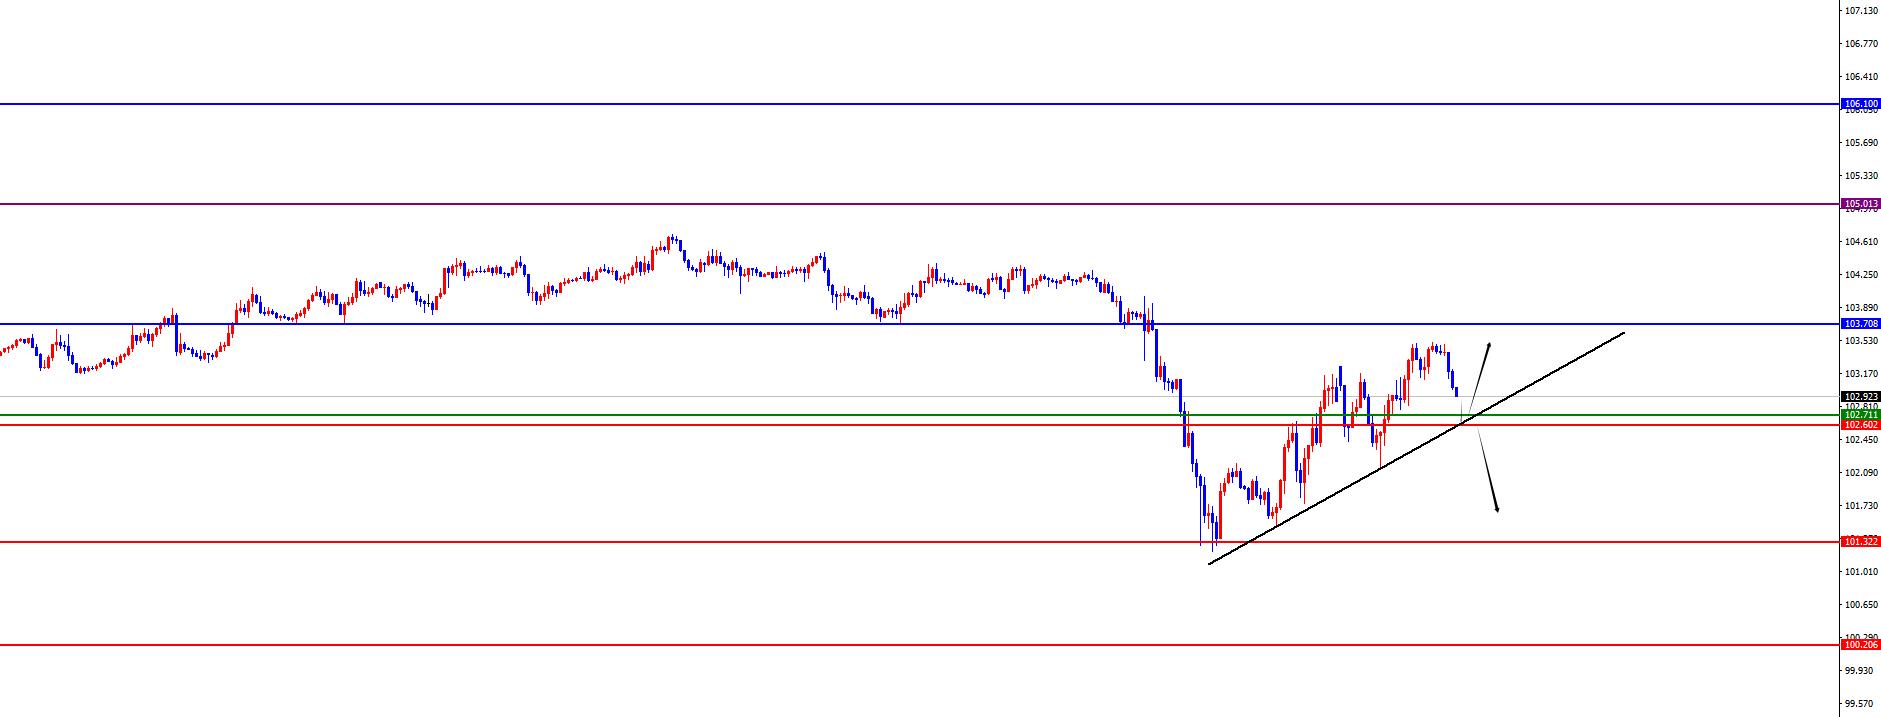
The US dollar index has a long range of 102.40-50, with a defense of 5 US dollars, and a target of 103-103.70
Gold
In terms of gold, the overall price of gold showed a sharp decline on Monday. The price rose to the highest point of 3055.35 on the day, and fell to the lowest point of 2956.44 on the spot, closing at 2981.8 on the spot. In response to the short-term gap opening low during the early trading session on Monday, the price quickly rebounded to the daily resistance area and then fluctuated in the European session. At the same time, the price fell again after the trading session and hit a low point in the week. Finally, the daily line ended with a big negative. The subsequent price is under pressure under daily resistance, and the weekly support area is focused below.
Through multi-cycle xm-links.comprehensive analysis, we can have a clearer understanding of the current price trend. Currently, the price is above the support levels of the weekly, monthly and daily lines, which shows that from a medium- and long-term perspective, the market is in a bullish trend. Specifically, the support level at the weekly level is near the 2900 area, and this position needs to be paid attention to in subsequent analysis.
Look at the daily level again, the resistance level is near the 3055 area, while the resistance level at the short-term four-hour level is in the 3035 area. Since the price is currently below the multi-cycle resistance level, we still recommend treating it with a bearish approach in terms of operational strategies.
From a shorter time period, i.e., one-hour level, prices have shown certain signs of rebound recently. Therefore, you can wait for the price to rebound near the four-hour resistance level to observe whether it will fall further under pressure. Follow the 2970-2940-2900 area belowsupport level for the domain.
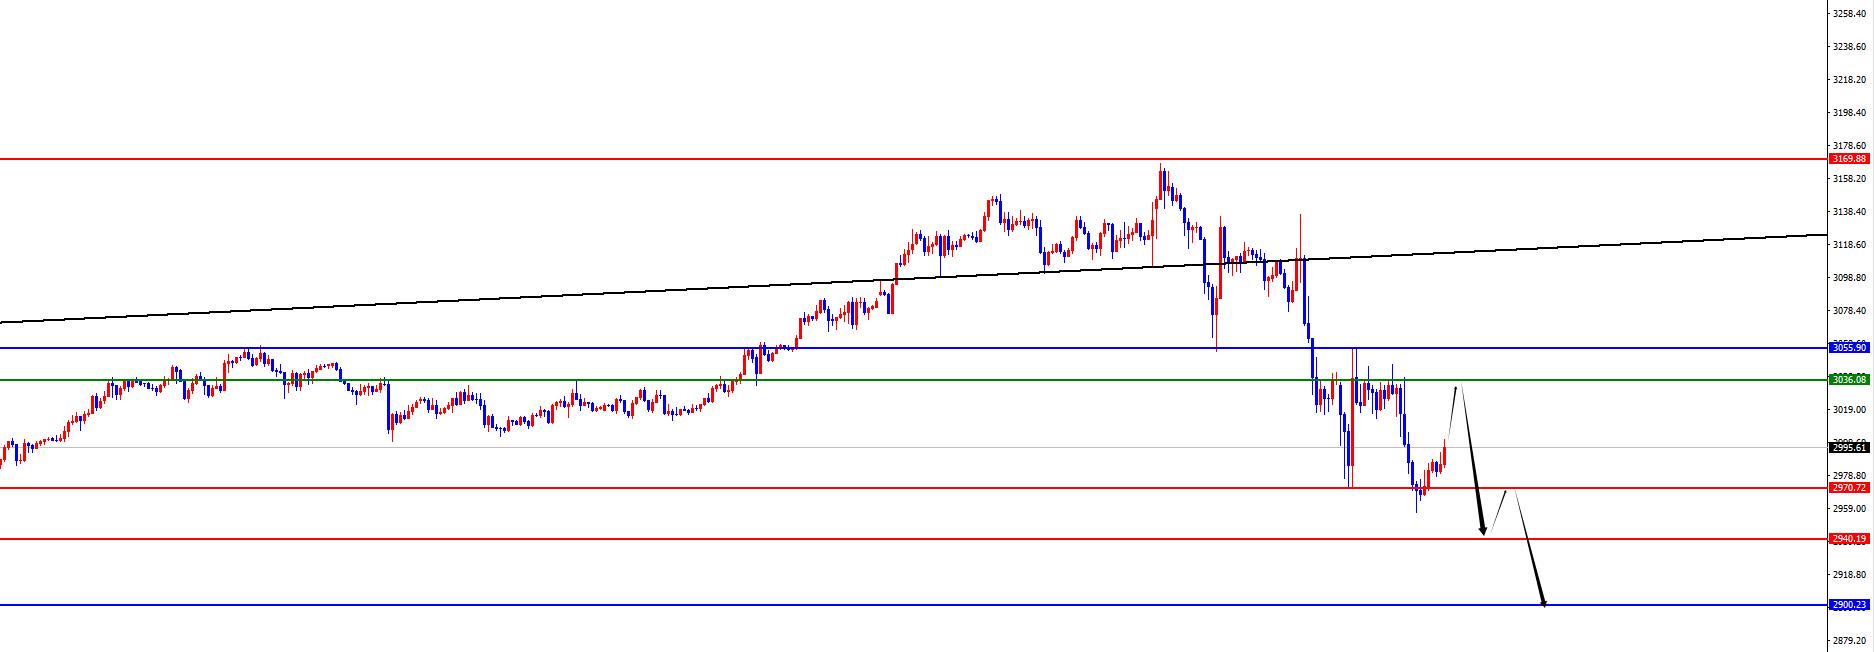
Gold 3035-36 has a short range, defense is 3056, target is 2970--2940-2900
Europe and the United States
Europe and the United States
Europe and the United States have generally shown an upward trend on Monday. The price fell to 1.0878 on the day and rose to 1.1049 on the spot and closed at 1.0905 on the spot. Looking back at the performance of European and American markets on Monday, the morning opening price first opened low in the short term, and the price stopped above the daily support. At the same time, the price tested upward to four-hour resistance. The price is currently continuing to pay attention to the daily support and the four-hour resistance range after breaking.
When conducting multi-cycle analysis, from the perspective of monthly lines, we need to pay attention to the support situation in the 1.0720 area in April, which is the key dividing point for judging long-term trends.
Switch to the weekly level, we should pay attention to the support of the 1.0590 area. It plays a key role in judging the mid-term trend and is an important watershed in the mid-term trend.
Looking at the daily level again, we need to pay attention to the support in the 1.0860 area. This position is the key to the band trend and determines the development direction of the band market.
From the short-term four-hour level, the resistance in the 1.0980 area is more critical, and it is an important factor affecting the short-term trend.
In addition, from the one-hour level, the price shows a trend of further upward movement. Therefore, the subsequent focus is on whether the price can break through the four-hour resistance level, which will play a decisive role in the short-term market trend.
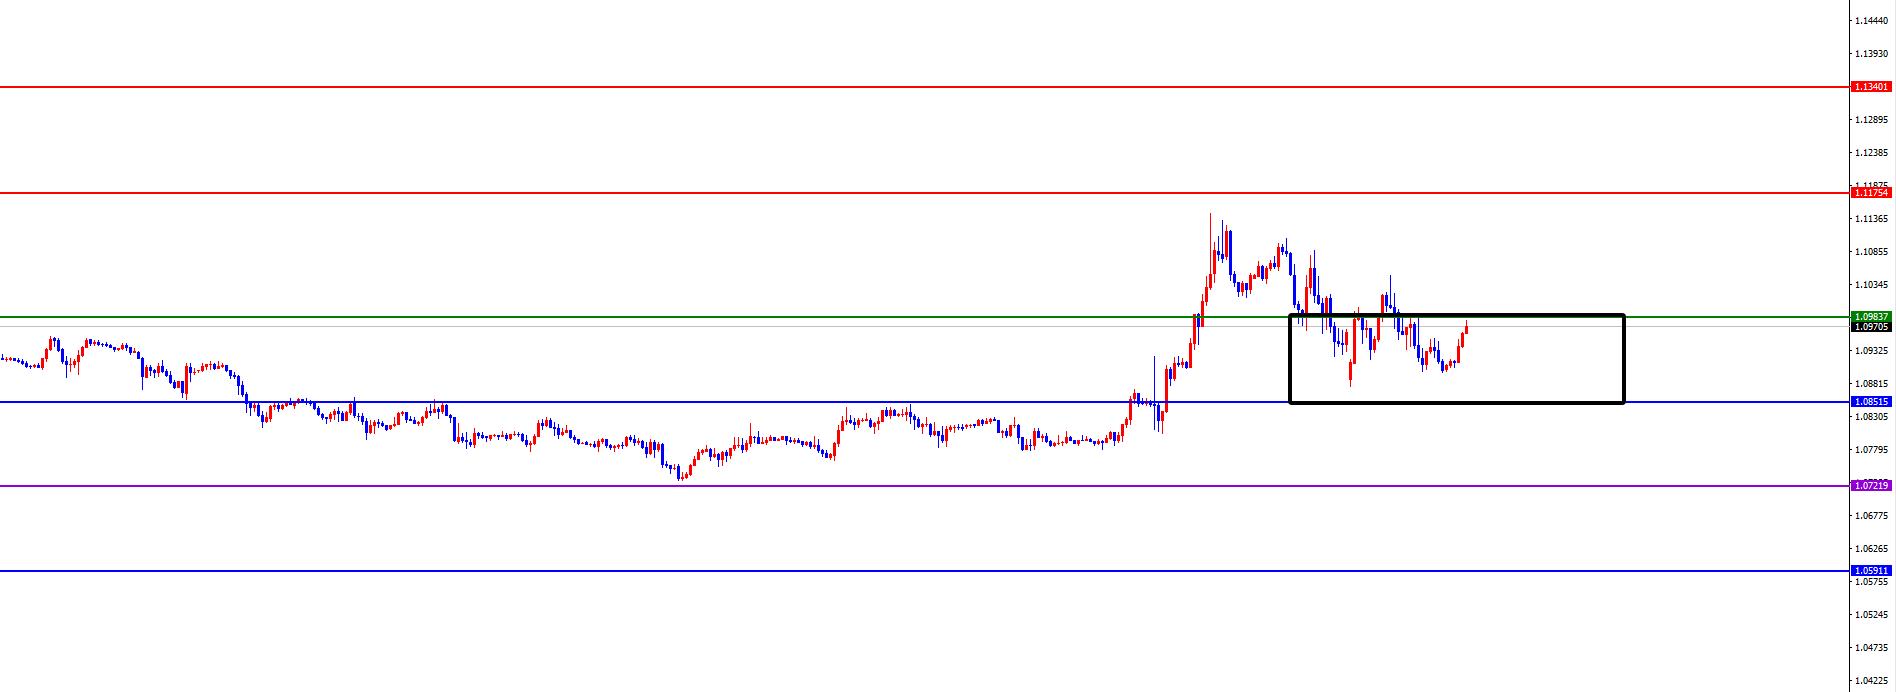
Europe and the United States pay attention to the 1.0850-1.0980 range breaks
[Finance data and events that are focused today] Tuesday, April 8, 2025
①07:50 Japan's February trade account
②14:45 France's February trade account
③18:00 United States March NFIB Small Business Confidence Index
④ The next day, EIA released its monthly short-term energy outlook report
xm-links.com⑤The next day, the Federal Reserve Daly attended the dialogue event
⑥The next day, the next day, the API crude oil inventories from the United States to April 4
Note: The above is only personal opinion and strategy, for reference and xm-links.communication only, and has not given any investment to customers.It has nothing to do with the customer's investment, and it is not used as a basis for placing an order.
The above content is all about "[XM Foreign Exchange Market Analysis]: Gold daily resistance is under pressure, Europe and the United States are paying attention to breaking the level". It is carefully xm-links.compiled and edited by the editor of XM Foreign Exchange. I hope it will be helpful to your trading! Thanks for the support!
Share, just as simple as a gust of wind can bring refreshment, just as pure as a flower can bring fragrance. The dusty heart gradually opened, and I learned to share, sharing is actually so simple.
Disclaimers: XM Group only provides execution services and access permissions for online trading platforms, and allows individuals to view and/or use the website or the content provided on the website, but has no intention of making any changes or extensions, nor will it change or extend its services and access permissions. All access and usage permissions will be subject to the following terms and conditions: (i) Terms and conditions; (ii) Risk warning; And (iii) a complete disclaimer. Please note that all information provided on the website is for general informational purposes only. In addition, the content of all XM online trading platforms does not constitute, and cannot be used for any unauthorized financial market trading invitations and/or invitations. Financial market transactions pose significant risks to your investment capital.
All materials published on online trading platforms are only intended for educational/informational purposes and do not include or should be considered for financial, investment tax, or trading related consulting and advice, or transaction price records, or any financial product or non invitation related trading offers or invitations.
All content provided by XM and third-party suppliers on this website, including opinions, news, research, analysis, prices, other information, and third-party website links, remains unchanged and is provided as general market commentary rather than investment advice. All materials published on online trading platforms are only for educational/informational purposes and do not include or should be considered as applicable to financial, investment tax, or trading related advice and recommendations, or transaction price records, or any financial product or non invitation related financial offers or invitations. Please ensure that you have read and fully understood the information on XM's non independent investment research tips and risk warnings. For more details, please click here