


Trusted by over 15 Million Traders
The Most Awarded Broker
for a Reason
Easy Access to 1,400+ Global Assets
EURUSD
Euro vs U.S. Dollar
US500
S&P 500 (US500)
GOLD
Gold
COFFEE
US Coffee
Apple
Apple (AAPL.OQ)
-

Finance Magnates 颁发
-

Finance Magnates 颁发
-

Capital Finance International Magazine (CFI.co) 2024年颁赠
-

COLWMA 2024年颁赠
-

荣获World Finance Forex Awards 2023最佳外汇客户服务奖
-

荣获World Finance Forex Awards 2023欧洲最佳外汇经纪商奖
-

荣获World Finance Forex Awards 2023澳大拉西亚最佳外汇经纪商奖
-

荣获World Finance Forex Awards 2023拉丁美洲最佳外汇经纪商奖
-

荣获World Finance Forex Awards 2023中东最佳外汇经纪商奖
-

CFI.co于2023年颁赠
-

荣获2023年City of London Wealth Management Awards
-

荣获2022年埃及金融博览会颁赠
-

荣获2022年City of London Wealth Management Awards
-

CFI.co于2022年颁赠
-

荣获Global Forex Awards 2022 — 零售外汇 颁赠
-
2021年迪拜外汇博览会获颁赠
-

Ultimate Fintech 2021年颁赠
-

荣获2021年City of London Wealth Management Awards
-

FX168于2020年12月颁赠
-

荣获Global Business Awards 2020
-

荣获2020年City of London Wealth Management Awards
-

Capital Finance International Magazine (CFI.co)颁赠
-

Capital Finance International Magazine (CFI.co)颁赠
-

荣获2019年City of London Wealth Management Awards
-

Shares Magazine 授予 UK Forex Awards 2018
-

Capital Finance International Magazine (CFI.co)颁赠
-

Capital Finance International Magazine (CFI.co)颁赠
-

2017年伦敦财富管理奖
-

2016最佳本土 客户服务
-

中东和北非地区(MENA)增长最快的经纪商
-
2015年最佳外汇科技提供商
-
2014年最佳外汇科技提供商
-

2014年最佳外汇科技提供商
-

荣获 The Trading Show 2024年非洲 Africa Fintech 峰会颁赠
-

荣获2024年中东地区 Brokersview 颁赠
-
荣获2024年中东地区 Brokersview 颁赠
-

荣获2024年阿曼 Smart Vision 峰会颁赠
-

荣获2024年迪拜外汇博览会颁赠
-

荣获2024年迪拜 Forex Traders Summit 颁赠
-

2024年埃及 Smart Vision 峰会颁赠
-

投查查于2024年颁赠
-

Capital Finance International Magazine (CFI.co) 2024年颁赠
-

CFI.co于2023年颁赠
-

CFI.co于2023年颁赠
-

交易社区平台FOLLOWME于2022年颁赠
-
2022年迪拜Forex Expo获颁赠
-
2022年迪拜Forex Expo获颁赠
-

荣获Global Forex Awards 2022 — 零售外汇 颁赠
-

CFI.co于2022年颁赠
-

CFI.co于2022年颁赠
-

World Finance Forex Awards 2022 颁发
-

World Finance Forex Awards 2022 颁发
-

World Finance Forex Awards 2022 颁发
-

World Finance Forex Awards 2022 颁发
-
交易社区平台FOLLOWME于2021年颁赠
-

2021年埃及Smart Vision Investment Expo博览会获颁赠
-

CFI.co于2021年颁赠
-

CFI.co于2021年颁赠
-

荣获Global Forex Awards 2021 — 零售外汇 颁赠
-

荣获Global Forex Awards 2021 — 零售外汇 颁赠
-

World Finance 2021颁发
-

World Finance 2021颁发
-
FOLLOWME于2021年颁赠
-

Global Forex Awards 2021 — B2B 颁赠
-

Global Forex Awards颁赠
-

Global Forex Awards颁赠
-

CFI.co于2020年颁赠
-

CFI.co于2020年颁赠
-

荣获Global Business Awards 2020
-

World Finance Magazine 颁赠
World Finance Forex Awards 2020 -

World Finance Magazine 颁赠
World Finance Forex Awards 2020 -
FOLLOWME交易社区授予
-

Global Forex Awards颁赠
-

Global Forex Awards颁赠
-

FinTech Age Awards颁发
-

World Finance Magazine 颁赠
World Finance Forex Awards 2019 -

World Finance Magazine 颁赠
World Finance Forex Awards 2019 -

荣获 World Finance Forex Awards 2018 颁赠
-

荣获2018年埃及金融博览会颁赠
-

荣获 Shares Magazine 的 UK Forex Awards 2017 颁赠
-

荣获 World Finance Forex Awards 2017
-

2016年最佳黄金经纪商
-

2016年最佳外汇经纪商
-

2015年最佳本地客户服务
-

Global Brands Magazine 颁赠
-

Online Money Awards 2022 颁发
-

荣获2022年埃及金融博览会颁赠
-

2015最佳外汇交易平台
-

2015最佳金融交易平台
-

2013最佳创新外汇平台奖
-

2020年 Cyprus HR Awards 颁赠
-

金融行业的佼佼者
-

认证最优金牌级别
-

2014年首届亚军
-
Finance Magnates 颁发
-
Finance Magnates 颁发
-
Capital Finance International Magazine (CFI.co) 2024年颁赠
-
COLWMA 2024年颁赠
-
荣获World Finance Forex Awards 2023最佳外汇客户服务奖
-
荣获World Finance Forex Awards 2023欧洲最佳外汇经纪商奖
-
荣获World Finance Forex Awards 2023澳大拉西亚最佳外汇经纪商奖
-
荣获World Finance Forex Awards 2023拉丁美洲最佳外汇经纪商奖
-
荣获World Finance Forex Awards 2023中东最佳外汇经纪商奖
-
CFI.co于2023年颁赠
-
荣获2023年City of London Wealth Management Awards
-
荣获2022年埃及金融博览会颁赠
-
荣获2022年City of London Wealth Management Awards
-
CFI.co于2022年颁赠
-
荣获Global Forex Awards 2022 — 零售外汇 颁赠
-
2021年迪拜外汇博览会获颁赠
-
Ultimate Fintech 2021年颁赠
-
荣获2021年City of London Wealth Management Awards
-
FX168于2020年12月颁赠
-
荣获Global Business Awards 2020
-
荣获2020年City of London Wealth Management Awards
-
Capital Finance International Magazine (CFI.co)颁赠
-
Capital Finance International Magazine (CFI.co)颁赠
-
荣获2019年City of London Wealth Management Awards
-
Shares Magazine 授予 UK Forex Awards 2018
-
Capital Finance International Magazine (CFI.co)颁赠
-
Capital Finance International Magazine (CFI.co)颁赠
-
2017年伦敦财富管理奖
-
2016最佳本土 客户服务
-
中东和北非地区(MENA)增长最快的经纪商
-
2015年最佳外汇科技提供商
-
2014年最佳外汇科技提供商
-
2014年最佳外汇科技提供商
-
荣获 The Trading Show 2024年非洲 Africa Fintech 峰会颁赠
-
荣获2024年中东地区 Brokersview 颁赠
-
荣获2024年中东地区 Brokersview 颁赠
-
荣获2024年阿曼 Smart Vision 峰会颁赠
-
荣获2024年迪拜外汇博览会颁赠
-
荣获2024年迪拜 Forex Traders Summit 颁赠
-
2024年埃及 Smart Vision 峰会颁赠
-
投查查于2024年颁赠
-
Capital Finance International Magazine (CFI.co) 2024年颁赠
-
CFI.co于2023年颁赠
-
CFI.co于2023年颁赠
-
交易社区平台FOLLOWME于2022年颁赠
-
2022年迪拜Forex Expo获颁赠
-
2022年迪拜Forex Expo获颁赠
-
荣获Global Forex Awards 2022 — 零售外汇 颁赠
-
CFI.co于2022年颁赠
-
CFI.co于2022年颁赠
-
World Finance Forex Awards 2022 颁发
-
World Finance Forex Awards 2022 颁发
-
World Finance Forex Awards 2022 颁发
-
World Finance Forex Awards 2022 颁发
-
交易社区平台FOLLOWME于2021年颁赠
-
2021年埃及Smart Vision Investment Expo博览会获颁赠
-
CFI.co于2021年颁赠
-
CFI.co于2021年颁赠
-
荣获Global Forex Awards 2021 — 零售外汇 颁赠
-
荣获Global Forex Awards 2021 — 零售外汇 颁赠
-
World Finance 2021颁发
-
World Finance 2021颁发
-
FOLLOWME于2021年颁赠
-
Global Forex Awards 2021 — B2B 颁赠
-
Global Forex Awards颁赠
-
Global Forex Awards颁赠
-
CFI.co于2020年颁赠
-
CFI.co于2020年颁赠
-
荣获Global Business Awards 2020
-
World Finance Magazine 颁赠
World Finance Forex Awards 2020 -
World Finance Magazine 颁赠
World Finance Forex Awards 2020 -
FOLLOWME交易社区授予
-
Global Forex Awards颁赠
-
Global Forex Awards颁赠
-
FinTech Age Awards颁发
-
World Finance Magazine 颁赠
World Finance Forex Awards 2019 -
World Finance Magazine 颁赠
World Finance Forex Awards 2019 -
荣获 World Finance Forex Awards 2018 颁赠
-
荣获2018年埃及金融博览会颁赠
-
荣获 Shares Magazine 的 UK Forex Awards 2017 颁赠
-
荣获 World Finance Forex Awards 2017
-
2016年最佳黄金经纪商
-
2016年最佳外汇经纪商
-
2015年最佳本地客户服务
-
Global Brands Magazine 颁赠
-
Online Money Awards 2022 颁发
-
荣获2022年埃及金融博览会颁赠
-
2015最佳外汇交易平台
-
2015最佳金融交易平台
-
2013最佳创新外汇平台奖
-
2020年 Cyprus HR Awards 颁赠
-
金融行业的佼佼者
-
认证最优金牌级别
-
2014年首届亚军

Awarded BestBrokerYear After Year
CATEGORIES
News
- 【XM Forex】--WTI Crude Oil Weekly Forecast: Polite Range Last Week Almost Too Pre
- 【XM Forex】--AUD/USD Forex Signal: Bullish Bounce Off $0.6345
- 【XM Forex】--GBP/USD Forex Signal: Could Rebound as Double-Bottom Forms
- 【XM Forex】--USD/MYR Forecast: US Dollar Pressing a Major Barrier Against Ringgit
- 【XM Group】--GBP/USD Forecast : British Pound Stalls During the Wednesday Session
market news
US stocks begin to rebound steadily, and gold 2956 is expected to be a short-term bottom
Wonderful introduction:
Optimism is the line of egrets that are straight up to the blue sky, optimism is the thousands of white sails beside the sunken boat, optimism is the lush grass that blows with the wind on the head of the parrot island, optimism is the falling red spots that turn into spring mud to protect the flowers.
Hello everyone, today XM Foreign Exchange will bring you "[XM Foreign Exchange Market Analysis]: US stocks have begun to rebound steadily, and gold 2956 is expected to become a short-term bottom." Hope it will be helpful to you! The original content is as follows:
Zheng's silver: US stocks began to rebound steadily, and gold 2956 is expected to become a short-term bottom
Review yesterday's market trend and technical points:
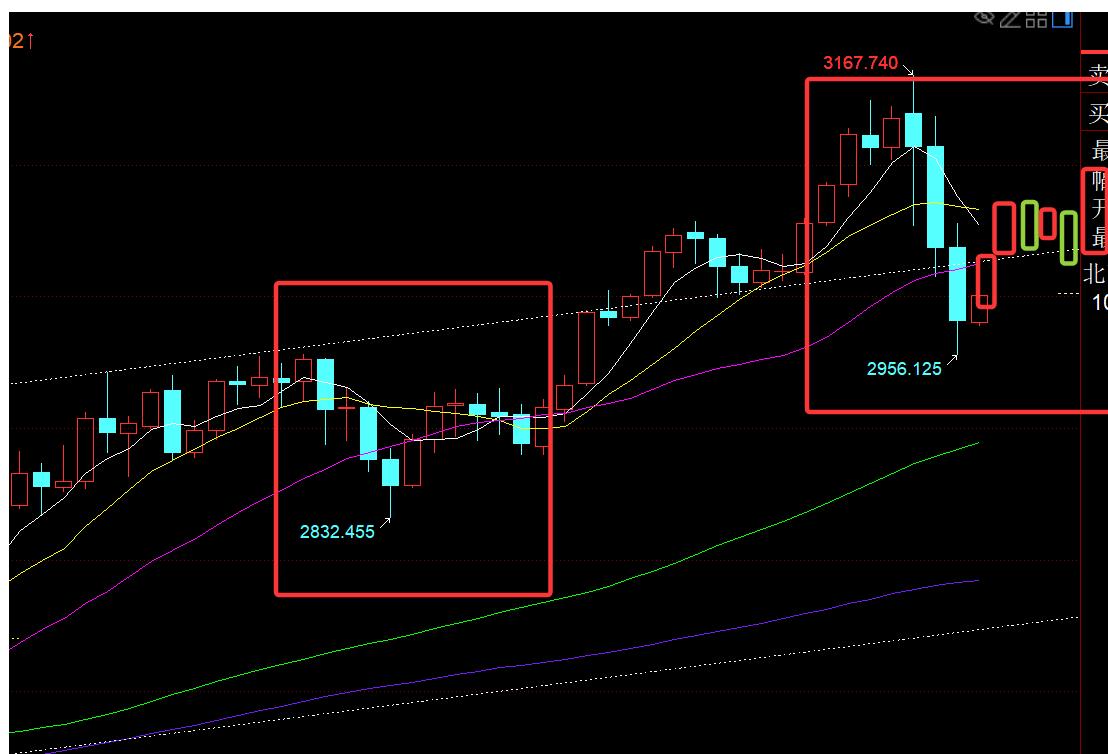
First, gold: Yesterday morning, it continued to sell in panic, touched the 2972 line and showed a wave of sharp pullback to the 3055 line; on the one hand, the 2980 position is the effective support level mentioned in the weekly video, and 2955 is also the top-bottom conversion point, at that time, the mid-track pressure point of the hour line, and the 50% division pressure level; for the large market trends in the morning, I remained relatively cautious for a while and did not rush to take action; until the European session began to reduce volatility and remained at the consolidation between 3014-3045, then 3025, 3026, 3024, and 3004 were given four continuous views. The rise, the first three times won 10 US dollars, the fourth time was slightly more, and the fourth time was slightly more, and the 20 US dollars (all based on several division support to judge); and they were all going to rest, so I looked at it before going to bed, and the price was given to the final division position of 2982, so I couldn't help it. I tried the short-term long position for the fifth time, because the US stock market had already rebounded at that time, and silver and crude oil could not resist the decline. I thought that gold had a probability of a second bottoming out and then a wave of pull-up after the end of the second bottoming, but I didn't expect that it could actually go to the strong weekly support mentioned in the 2960-56 week video, with the extreme pull-up point, and then reversed;
Second, silver and crude oil have not been laid out in the past two days; the weekly video also pointed out that there was a key support at 28.5 in the lower track of the weekly channel. After touching yesterday, it ushered in a wave of sharp rebound. I didn't dare to take action early in the morning, so I missed the opportunity;
Interpretation of today's market analysis:
First, gold daily line level: Yesterday, the closing report was a big negative with a lower shadow line, which fell below the middle track 3025 line, with a low of 2956, and from the high of 3167, the decline has exceeded 200 US dollars; there were many voices in the market, believing that gold's short-term trend is about to go short, and it will fall below 2900, 2800, or even 2600; in fact, when you open the monthly line cycle chart, it is just a small negative pullback, with an increase of about half in March, and still maintaining a clear bullish trend. I personally think that there is a high probability that it will close in April with a long lower shadow K, and then continue to pull strongly in May, pointing to above 3200, Very optimistic about the bullish trend in the future market, then the suppression and squats in the past few days are actually a good thing, because it will xm-links.come out with a relatively good low, and you can grasp the bullish band; now, it is here, the low 2956 that hit overnight is likely to become a short-term correction bottom, because it is a strong support for the weekly MA10 moving average and the top and bottom position in February this year. At the same time, 2960 belongs to the 618 segmentation position back-tested by 2832-3167. The important 618 will be a turning point in many cases; finally, xm-links.compared with the trend from the end of February to the beginning of March, you can find that it has similarities: first fake breaking the middle track, then gradually re-standing on the middle track, and then brewing through a sideways trading week. Digestion, and finally unilaterally strongly hit a record high; then if you can close around the middle track 3025 today, or you can re-standing on the middle track within two days, and then maintain sideways within a certain range, and these steps are verified step by step, history will be surprisingly similar; therefore, pay attention to the gains and losses of the 3025 line today;
Second, gold 4-hour level: At this time, test the MA10-day moving average resistance, once you break through to stand on it tonight, you can gradually attack and test the middle track 3055 line; MACD has almost released short positions, and a golden cross is brewing under the zero axis, accumulating long momentum;
Third, gold hourly line level: So far, Asia and Europe today It is considered that there has been a process of continuous slow rise in fluctuations, and the MA10-day moving average has not yet fallen effectively, which also implies that there is indeed a large support for the overnight low of 2956; tonight, pay attention to the middle track above 2992 and hold 2992-90, and there is hope to further break through the European high point of 3015.5, and the upper rail counterpression points of the two channels above 3020-25 may still be suppressed. If the oscillation is grinding, it will generally be easy to break up after the sideways market brewing, and it will be easy to break up. See if the force is exerted in the second half of the night; tonight, it tends to continue to be bullish above 2994-95, 2990 is a feng shui hill, with resistance of 3015, 3020-25, and the upward break is effectively looking at 3045, 3055;
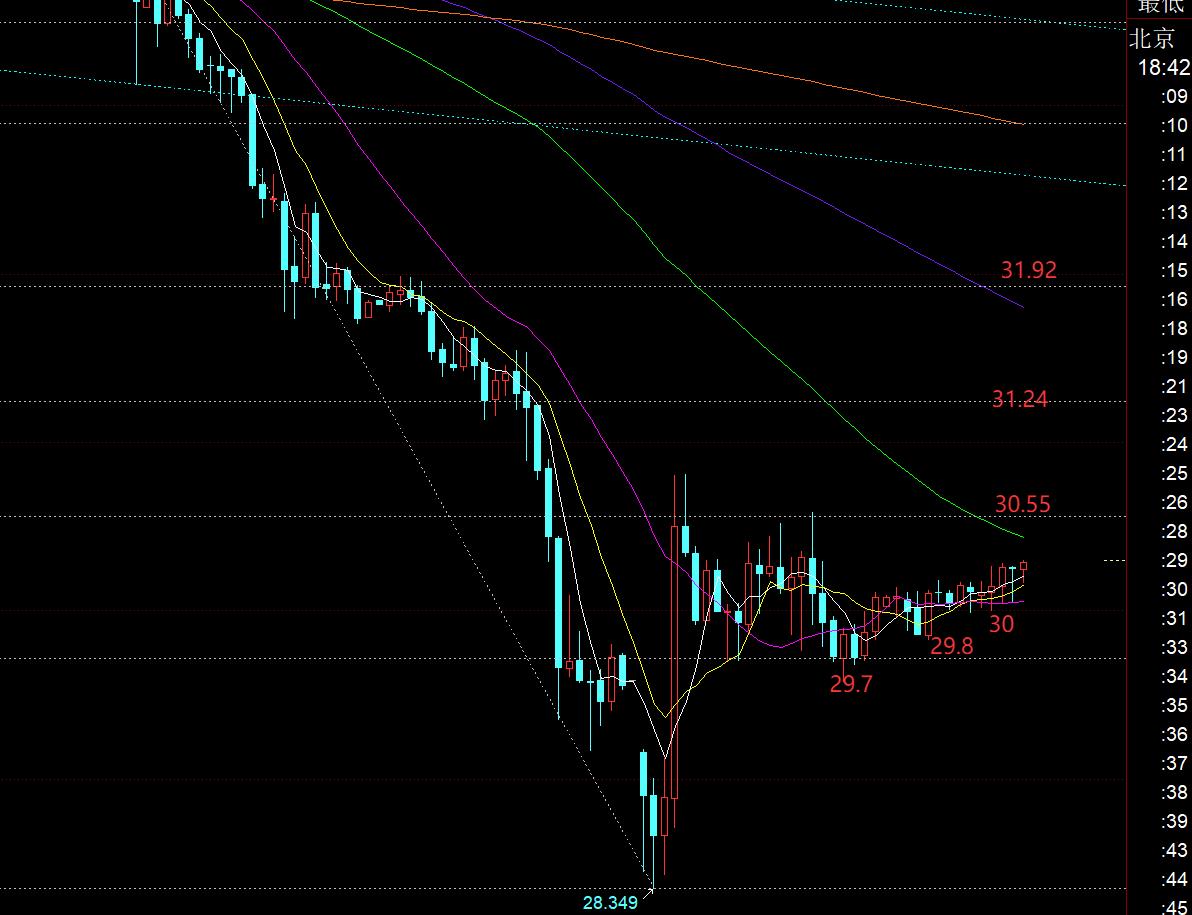
WhiteOn the silver side: the daily line closes to a long shadow K, and the bottom has a certain signal of stabilization; from the above chart, the trend is very slow, and the resistance is still the several division pressures mentioned yesterday, and the support 29.7, 29.8, and 30 is gradually moving upward. Tonight, look at 30.55 first. If you can break through, look at 31.24, etc., and will continue to fluctuate wider below 31.92;
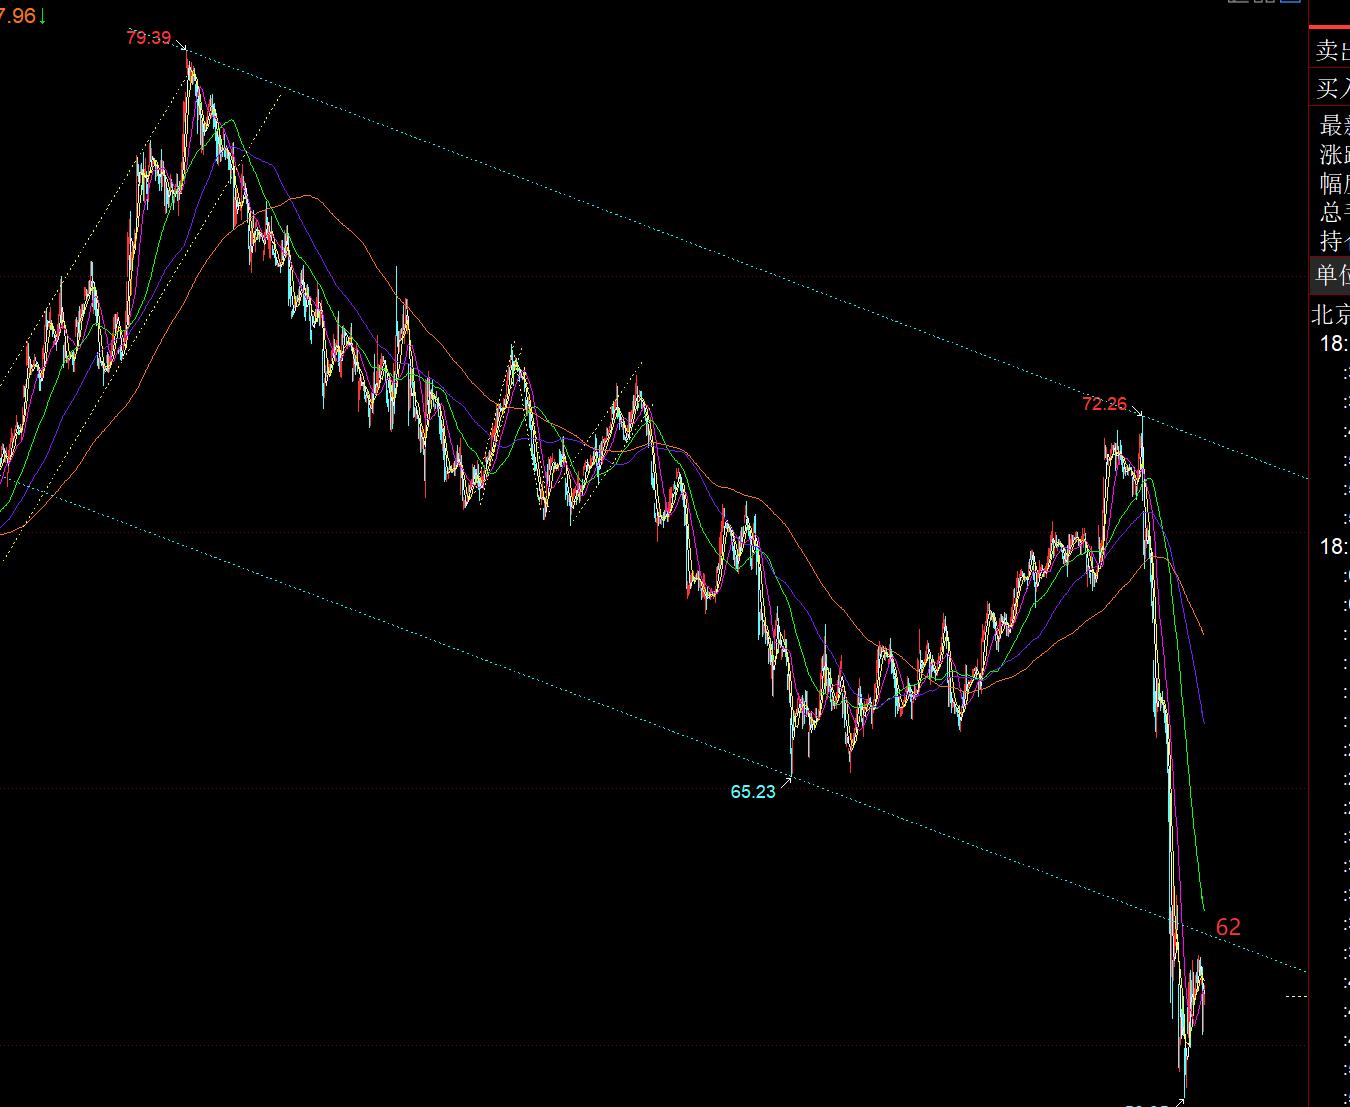
Crude oil: From the above picture, I pulled a wave hard yesterday, but I still failed to break through the counter-pressure point on the upper side. Today I moved down 62, and at the same time I paid attention to whether the low point can gradually move upward; once I stood firm at 62, crude oil will also carry out an oversold rebound correction;
The above are several points of the author's technical analysis. As a reference, it is also a summary of the technical experience accumulated by the market watching and reviewing for more than 12 hours a day in the past ten years. The technical points will be disclosed every day, and they will be interpreted in conjunction with text and videos. I want to learn. Friends, you can xm-links.compare and refer to the actual trends; those who recognize ideas can refer to operations, lead defense well, risk control first; those who do not recognize them should just be over; thank everyone for their support and attention;
【The views of the article are for reference only, investment is risky, and you need to be cautious, rational, strictly set losses, control positions, risk control first, and you will be responsible for your own profits and losses]
Contributor: Zheng's Dianyin
Review the market for more than 12 hours a day, and insist on for up to ten years. href="https://xm-links.com/">xm-links.com Over the years, detailed technical interpretations are made public on the entire network, serving to the end with sincerity, sincerity, perseverance and wholeheartedness! xm-links.comments written on major financial websites! Proficient in the K-line rules, channel rules, time rules, moving average rules, segmentation rules, and top and bottom rules; student cooperation registration hotline - WeChat: zdf289984986
The above content is about "[XM Foreign Exchange Market Analysis]: US stocks have begun to rebound steadily, and gold 2956 is expected to become a short-term bottom". It is carefully xm-links.compiled and edited by the XM Foreign Exchange editor. I hope it will be helpful to your trading! Thanks for the support!
Due to the author's limited ability and time constraints, some content in the article still needs to be discussed and studied in depth. Therefore, in the future, the author will conduct extended research and discussion on the following issues:
Disclaimers: XM Group only provides execution services and access permissions for online trading platforms, and allows individuals to view and/or use the website or the content provided on the website, but has no intention of making any changes or extensions, nor will it change or extend its services and access permissions. All access and usage permissions will be subject to the following terms and conditions: (i) Terms and conditions; (ii) Risk warning; And (iii) a complete disclaimer. Please note that all information provided on the website is for general informational purposes only. In addition, the content of all XM online trading platforms does not constitute, and cannot be used for any unauthorized financial market trading invitations and/or invitations. Financial market transactions pose significant risks to your investment capital.
All materials published on online trading platforms are only intended for educational/informational purposes and do not include or should be considered for financial, investment tax, or trading related consulting and advice, or transaction price records, or any financial product or non invitation related trading offers or invitations.
All content provided by XM and third-party suppliers on this website, including opinions, news, research, analysis, prices, other information, and third-party website links, remains unchanged and is provided as general market commentary rather than investment advice. All materials published on online trading platforms are only for educational/informational purposes and do not include or should be considered as applicable to financial, investment tax, or trading related advice and recommendations, or transaction price records, or any financial product or non invitation related financial offers or invitations. Please ensure that you have read and fully understood the information on XM's non independent investment research tips and risk warnings. For more details, please click here